Via Utility Dive: " What could save Arizona tens of millions in annual customer and infrastructure costs? Residential pool pumps.: If Arizona Public Service and Salt River Project customers were to schedule pool pump… https://t.co/uhWmNFoGx7 " #Energy#Utility#Utilities
$MP $UUUU $UAMY $USAR $LAC $CRML | Japanese chemical leader Shin Etsu maps out a 35 billion yen investment to construct a new rare earth refining facility in Fukui Prefecture.
The state backed project aims to insulate local tech manufacturing from harsh export limits.
"current release—if fully exhausted—is set to bring inventories down to 243 million barrels, a historically low level. Drawing further frm the stocks after that would limit the US’s ability to respond to new oil disruptions or natural disasters that can damage fuel supply chains"
Big news for the lithium market: China just announced a major plan to scale electric heavy-duty trucks, aiming for 40% market penetration and a fleet of over 1.6 million vehicles by 2030. Given the massive battery size needed for these trucks, this is a huge long-term demand flag
The UK economy contracted by 0.1% in April, with services down 0.2%.
The UK has the same structural weakness the EU faces: excessive exposure to imported fossil fuels.
Even with North Sea production, the UK still has net energy import dependency of around 44%.
This is why political leaders arguing against electrification are being deeply irresponsible.
Energy sovereignty is not ideology for Europe. It is macroeconomic stability.
The faster Europe and the UK reduce fossil fuel dependence, the lower their exposure to external shocks, inflation spikes and repeated growth slowdowns.
South Australia's first long-duration FERM tender was a clean sweep for batteries, despite gas being eligible.
So what will be the role of gas in the energy transition?
My take 👇
NOAA officially declare El Nino onset Sustained +>0.5C SST anomalies in Nino 3.4 region of Equatorial Pacific
Cross model support for it to strengthen
Atmosphere responding as
captured by sustained <=-7 SOI index
BoM still to declare El Nino
Blog here-
https://t.co/9URaAIYjzA
Around the world, massive data centres are driving up electricity bills and emissions - we can't repeat those mistakes here in Victoria #AI#datacentres
True journalism seeks truth, facts, and accuracy grounded in actual fundamental reality, not hiding behind both-side-ism for clicks built on innumerate, bad faith intellectual dishonesty.
🇳🇿 New Zealand - May 26 - BEV Trajectory
10.0% BEV
5.7% PHEV
84.4% ICE (of which 34.5%p were HEV)
Trailing 12 months are:
6.0% BEV
4.6% PHEV
89.4% ICE (of which 38.1%p were HEV)
Graphs are available in the Gallery: https://t.co/3f4RtYFVSz
Wow, straight out of the ‘50s.
It says something about the demographics of the cycling charities who advise these #ActiveTravel councils and draft their press releases for them in return for payment with taxpayer cash.
Good morning with good news: India's Morena solar & 1-hour storage project's power will be $29/MWh.
In places with good solar/wind, RE & storage costs $54-$82/MWh that will operate 95% of time.
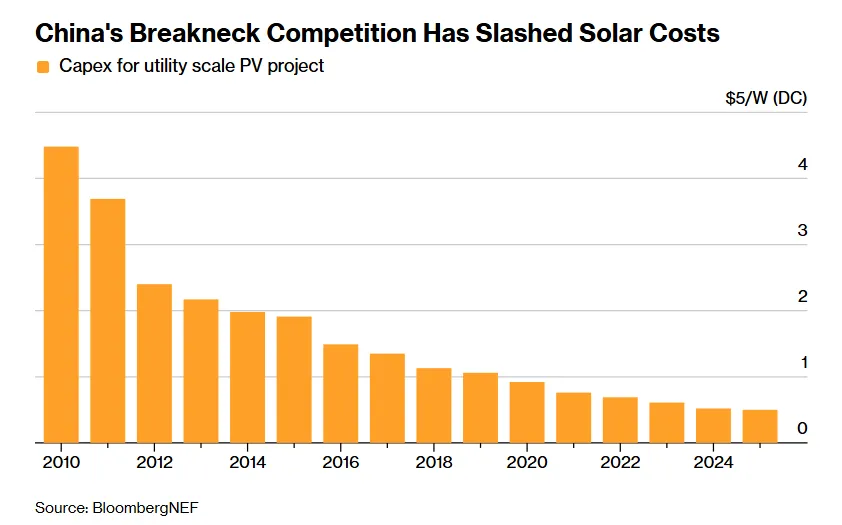
Capex cost of large solar fell from $1.91 in 2015 to $0.50/watt in 2025!
We know the recent rise in atmospheric CO₂ is mainly from burning fossil fuels because the atmosphere carries their isotopic fingerprint.
Fossil fuels are made from ancient plants and are depleted in carbon-13 (¹³C). As atmospheric CO₂ has risen from ~280 ppm before industrialisation to more than 430 ppm today, the proportion of ¹³C in the atmosphere has steadily fallen exactly as expected if coal, oil and gas are the source.
At the same time, atmospheric oxygen levels have declined as oxygen is consumed during combustion.
China’s CO₂ emissions have been flat or falling for the past 21 months.
Global emissions have not peaked yet, but there is growing evidence that they could peak around the end of this decade before beginning a sustained decline as renewables, storage, EVs and electrification continue to scale up worldwide.
🆕 New Feature in the Gallery: Comparison
Select up to 3 Regions/Countries and have their trajectories side by side:
https://t.co/i4DYz29jfC
(Be careful with the data points, some years miss some countries since data is generally all over the place.)