For this #TidyTuesday, I looked at the salary range in the US for each industry, education and showed the gender gap by industry.
Code : https://t.co/Pqie3OtgA3
#rstats#dataviz#r4ds
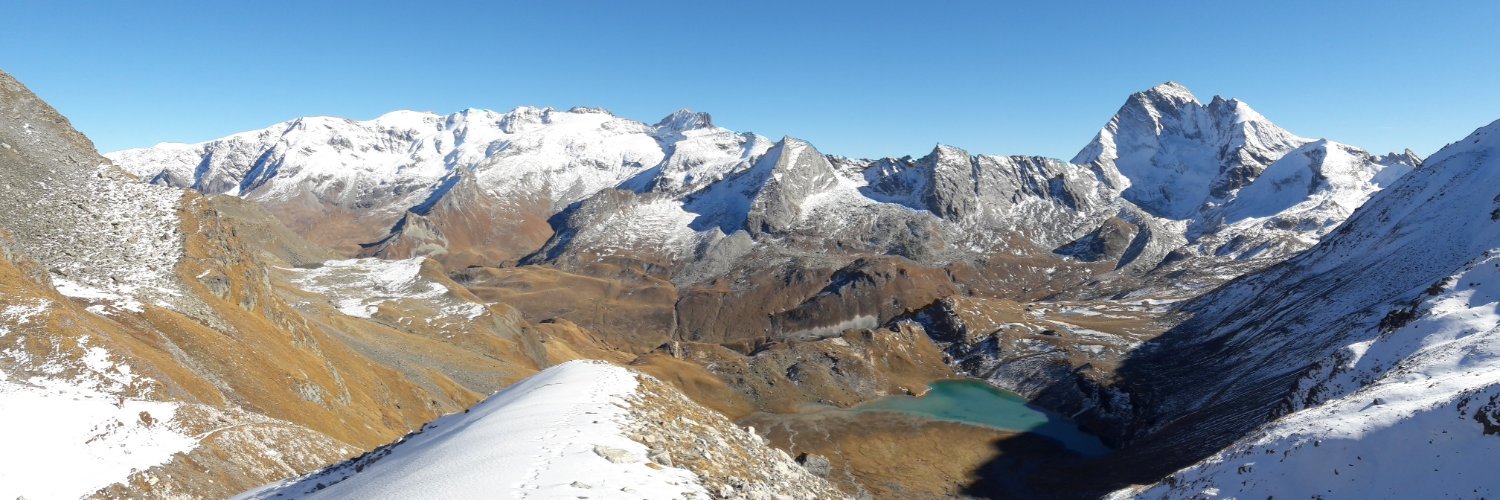
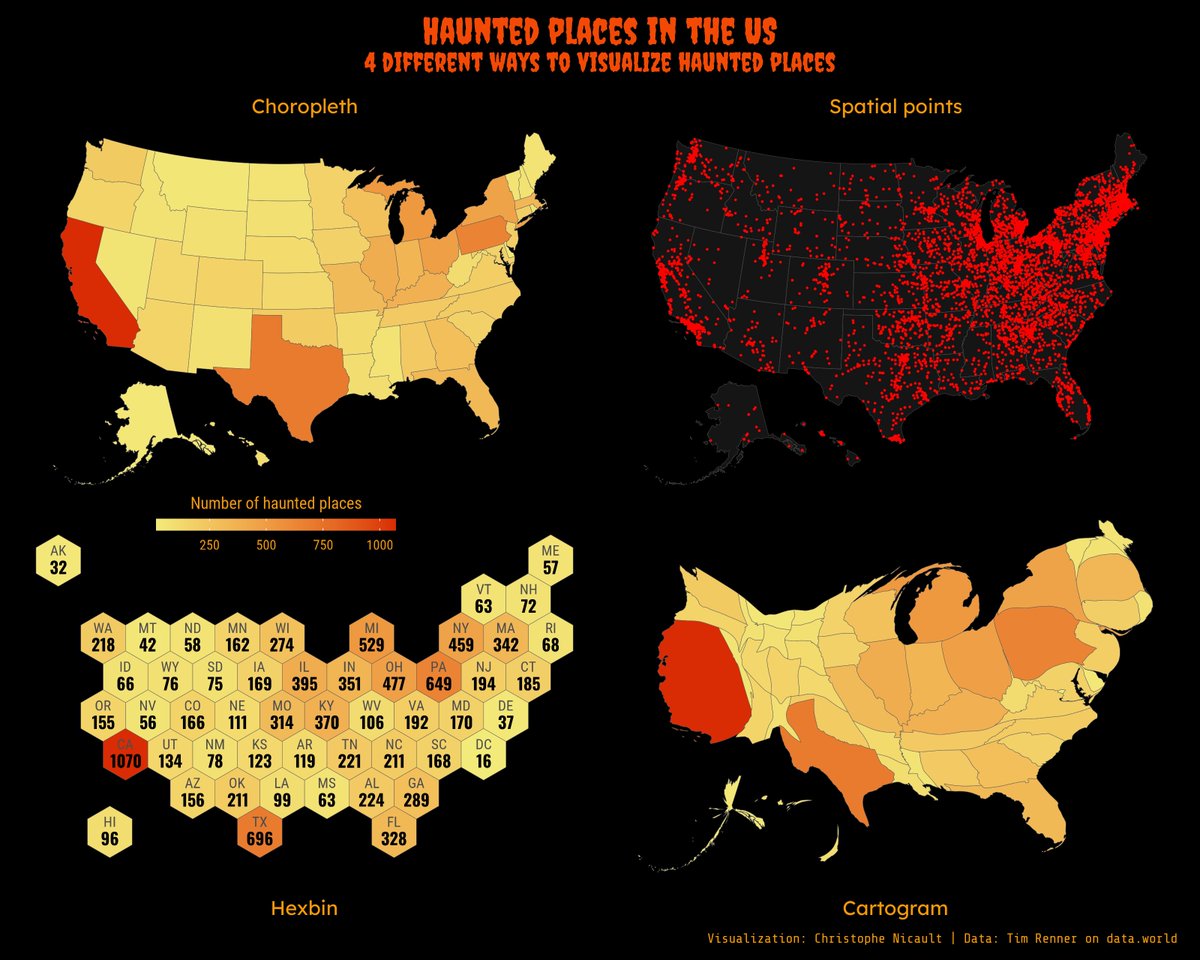
It's been almost a year since my last #TidyTuesday and post here, and as I wanted to practice a bit with maps and {sf}, I visualized the same information on four different maps.
Code & full size : https://t.co/Pqie3OtgA3
#rstats#dataviz#r4ds#ggplot
@ericMauviere@ApacheArrow@duckdb Yes, however in my example the duckdb file was created from the parquet file to compare them with the full dataframe for speed and size.
In a real case scenario using duckdb, I would create a database with multiple tables and do the joins in the SQL query.
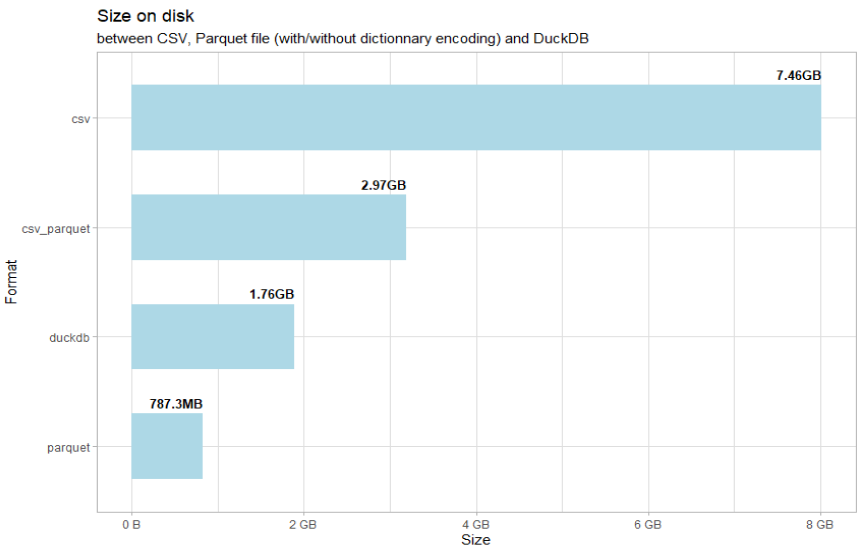
Dealing regularly with large datasets, I experienced how to integrate @ApacheArrow and @duckdb into my process with #rstats. I summarized how to use them together, the different format and did a benchmark on size and performance.
In English & French: https://t.co/rBxkqRmKpW
@ericMauviere@ApacheArrow@duckdb Sure, I did it with a parquet file with no partitioning, and updated version of the packages, but same query.
Arrow & dplyr 2.07s, duckdb engine & dplyr 2.33s and duckdb & sql 1.7s.
I tested it on my 6yo laptop, on that example only, it's not a proper benchmark.
@ericMauviere@ApacheArrow@duckdb Thank you. Yes certainly, my goal here was not to compare duckdb vs parquet, but to show the benefits of using either vs csv. The post is to help beginners to get started with both, and the flexibility to use both arrow and duckdb, with caveats that can be confusing at first.
Tag 5 des #AdventkalendR
Ein Überblick über die durchschnittlichen Gehälter nach Branchen und Bildungsabschlüssen in Österreich.
Datengrundlage ist die letzte Verdienststrukturerhebung 2018 von @STATISTIK_AT. Die nächste Erhebung startet 2023. Inspiration: @cnicault.
@tkaiser_science For user's authentication, there's shinymanager. You can then add a control for accessing each module depending on the profil logged in.
https://t.co/2SOMUgPyWb
A bit late for Halloween, but there's no better day than a rainy Saturday in November to work on a horror movie dataset for #TidyTuesday.
Code & full size : https://t.co/Pqie3OKRrB
#rstats#dataviz#r4ds#ggplot
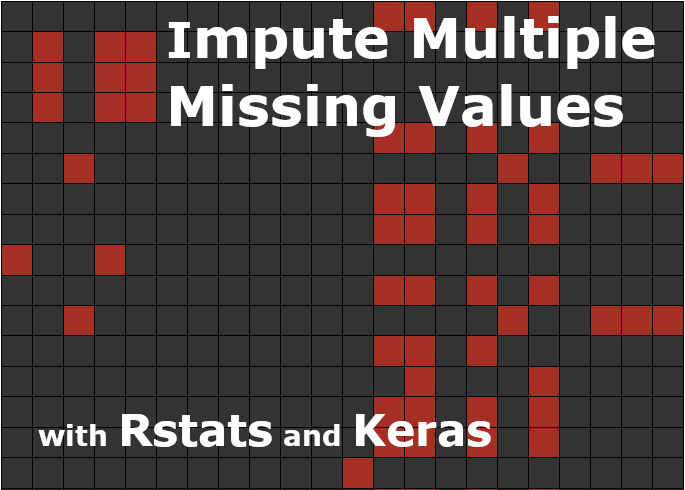
I wrote a post (English and French) about how to do multiple imputations of missing values with #rstats and #Keras, using the data of the #Kaggle TPS June competition, containing 1 million missing values.
Details: https://t.co/wlOyJe93mu
Code: https://t.co/zYu5qURYtj
A simple visualization for this #TidyTuesday to show the evolution of the number of transistors per chip and their process size.
Code & full size : https://t.co/Pqie3OtOpB
#rstats#dataviz#r4ds#ggplot
For this #TidyTuesday, I looked at 8 of Breaking Bad main characters to shows the top 3 Myers Briggs Type Indicator match for each of them, and their top 6 personality traits.
Code & full size : https://t.co/Pqie3OtgA3
#rstats#dataviz#r4ds#ggplot
@Ifeanyidiaye Thank you! I didn't use a package for the analysis, all the data with the personality traits and Myers Briggs Type Index are available from the Open Source Psychometrics Project.
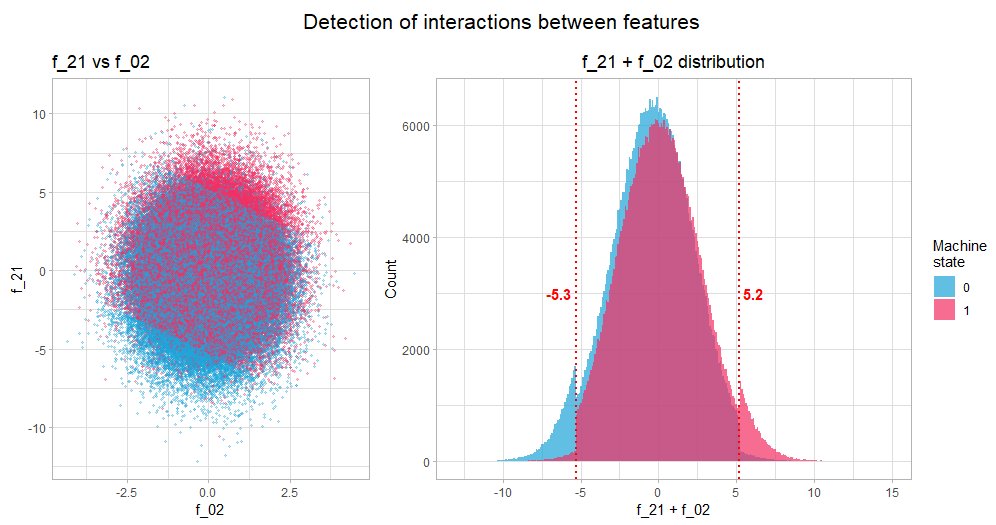
Interested in #DeepLearning and #rstats? I played with #Keras for #rstats to solve a binary classification problem, using Kaggle's May 2022 competition.
3 months later, I finally wrote about it and share the code.
Details: https://t.co/OZV7FPouK5
Code: https://t.co/bO4Vr5NU2T
When hearing for the first time about #processmining, it can be challenging to go beyond the sales pitch to understand how it works.
I wrote an introduction post with a very simple example, and with a demo application, using #rstat, #python and #shiny.
https://t.co/lGQ93zmBi3
For this #TidyTuesday, I used a connected scatterplot to show the link between increasing access to clean fuel for cooking and decrease of death from indoor air pollution.
Code : https://t.co/Pqie3OtgA3
#rstats#dataviz#r4ds
I’ve written a textbook on improving your statistical inferences. It consists of the content I teach in workshops, and combines material from my MOOC’s, blog, and published work. It’s a free open educational resource: You can read it here: https://t.co/FdQIS63fVd