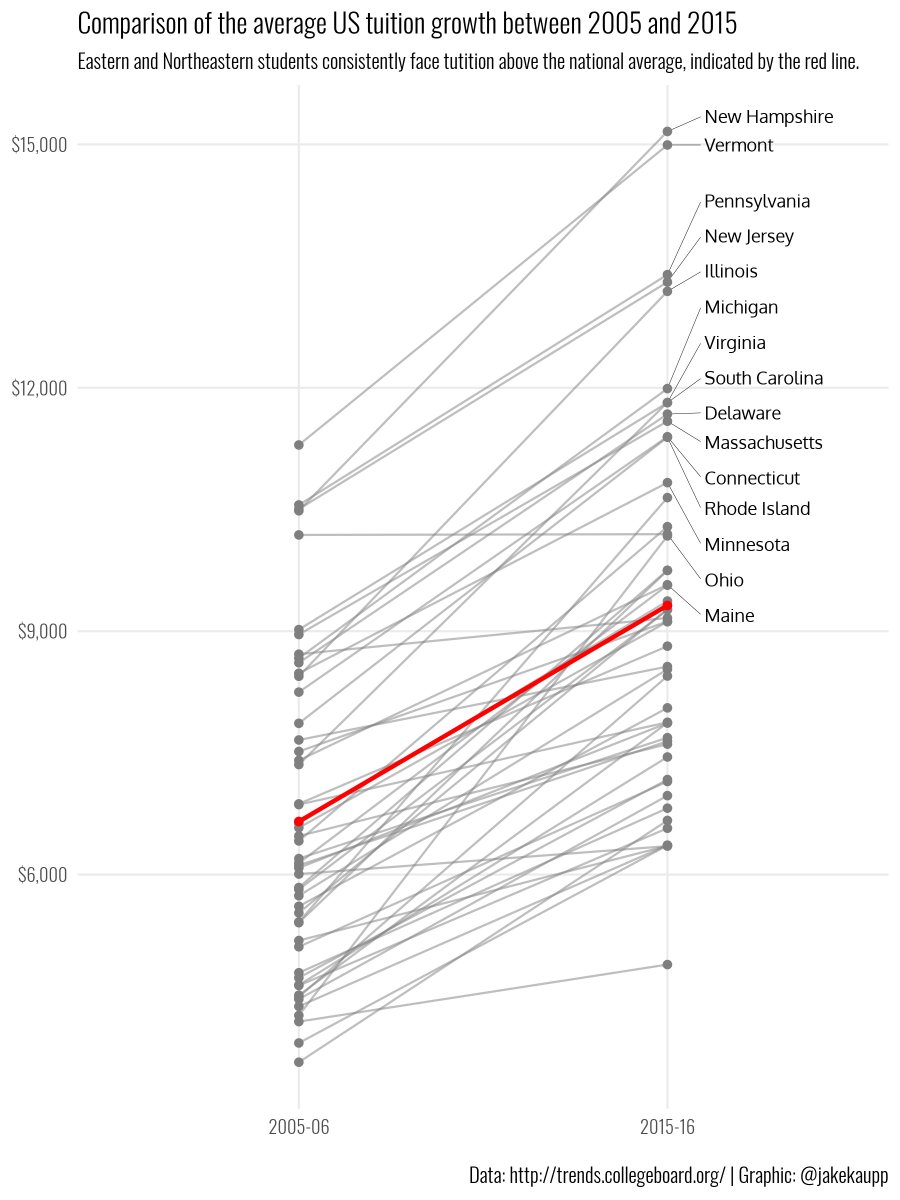
@tanya_shapiro The first submission I ever did for #TidyTuesday was this. I think I revisited this one anytime I did a slopegraph and tried to do better a bit at a time.
@CedScherer@geokaramanis@sciam@USDA@DroughtCenter @ChristiansenJen @ClaraMoskowitz Most of my jobs were research oriented for small teaching & learning related projects and weren’t purely in vis. Blended a lot of package development in R and shiny alongside some visualization primarily for reporting.
@geokaramanis@CedScherer@sciam@USDA@DroughtCenter @ChristiansenJen @ClaraMoskowitz Glad to hear that you’ve started freelancing! If I hear anything, I’ll send them your way!
I’ve stepped back from that last year as I had enough on my plate with remote work/ kids school/everything. Maybe in the future, as I do love collaborating!
@pradeeperanti @ClausWilke @CedScherer@ikashnitsky I would recommend checking out https://t.co/yR3VSCGPaO, https://t.co/DDz8eaM0oG and https://t.co/PhlJY1e1HR
@CedScherer I agree, I couldn't find one I liked. Did a panel approach with colorspace and in the end just went with this and a white buffer around the map.
A late #TidyTuesday for week 27 looking at London animal rescues. Wanted to try out @CedScherer’s background approach to facetted maps back in week 19.
Code @ https://t.co/1BhlhPnYyC #r4ds#rstats#dataviz
@CedScherer Thank you!
It’s a direct map to a colour. There wasn’t anything aside from total numbers of rescues and I didn’t like the way it worked so I went with a consistent colour.