BREAKING: President Trump addresses the people of Iran:
"Stay sheltered, don't leave your home. It’s very dangerous outside, bombs will be dropping everywhere. When we are finished, take over your government. This will be probably your only chance for generations."
BREAKING: President Trump is planning to invoke new "across the board" tariffs after the Supreme Court ruled against his tariffs today, per NYT.
This includes potentially invoking new trade authorities and Section 122 tariffs.
We can officially say goodbye to CME gaps for $BTC starting May 29th.
A strategy that delivered a 98% fill rate over the past 3 years will now be removed.
Expect weekend algos to adapt, the game is changing.
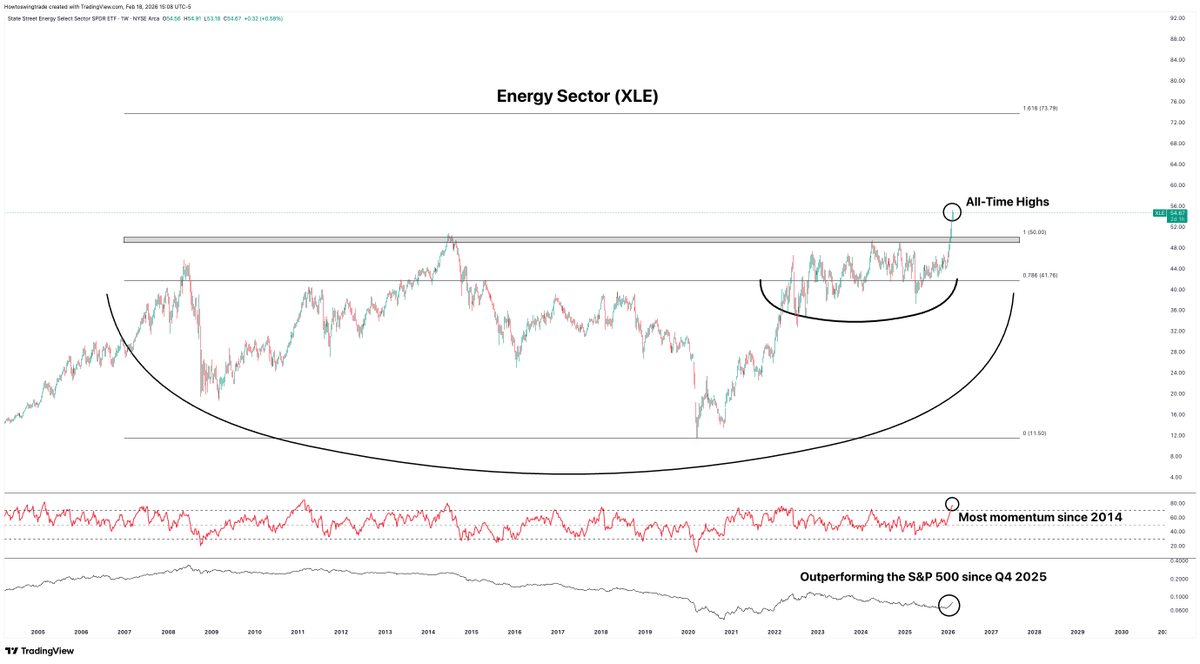
The Energy sector has been pinned underneath the weight of its own all-time highs since 2014.
That changed when $XLE broke out above 50.00 for the first time ever earlier this year.
Leading higher late last year was Exxon Mobil $XOM - the most liquid leader in the sector.
Many assume the Energy trade is the product of a rotation into a more defensive positioning due to Software and AI trouble.. and are either taking short-term positions or foregoing participating entirely.
Massive bases like we see in XLE don't resolve higher after decades of pent up volatility only to roll back over a couple of weeks later.
This is a secular breakout -- a change in the opinion of the future of the Energy trade. And financial institutions are speaking their opinions with their money.
It's likely that this trade continues to work for months, quarters, or years. Not days or weeks.
I opened a new position today in the sector. And I plan on continuing to position myself into the strongest candidates within Energy for the foreseeable future.
TTI the trade is in your inbox.
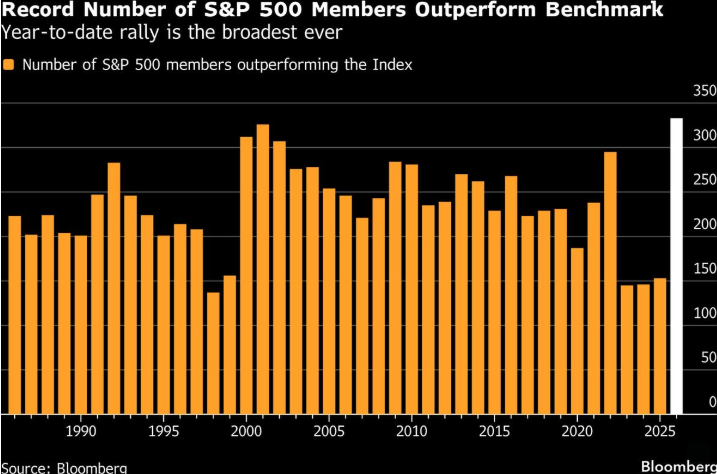
Number of S&P Stocks Beating Index Is at Record (Bloomberg)
Roughly 66% of the individual stocks in the S&P 500 are beating the index so far this year — which would put it on pace for the highest level of breadth in the market in records going back to 1986.
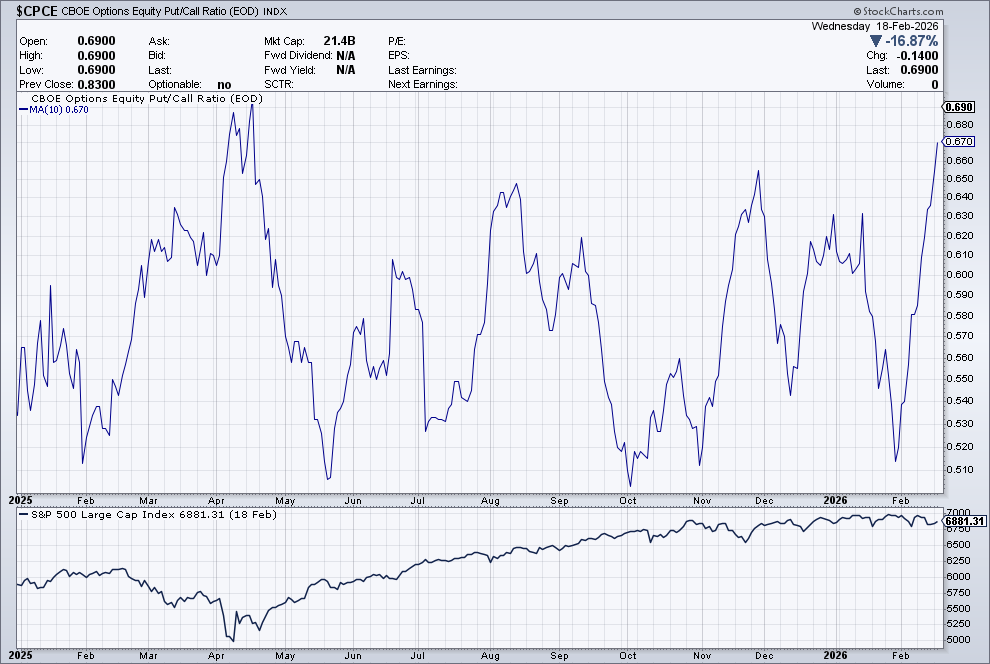
$CPCE - The 10 day moving average of the Equity Put/Call ratio has reached 0.67. That's the highest level of the 10 day average since the April low in the market when it topped at 0.695.
Hard to look at current prices and not see opportunity.
Boring times and a bit of patience is usually all that separates the winners from the ones who missed it.
Be honest with yourself:
You know every pattern.
You can spot divergences in your sleep.
Your chart game is flawless.
So why are you still losing money?
Because technicals don't make you money.
Execution does.
And execution means:
- Not revenge trading after a loss
- Taking profits when you said you would
- Cutting losses before they become disasters
- Sitting on your hands when there's no setup
You already know how to read charts.
Now learn how to read yourself.
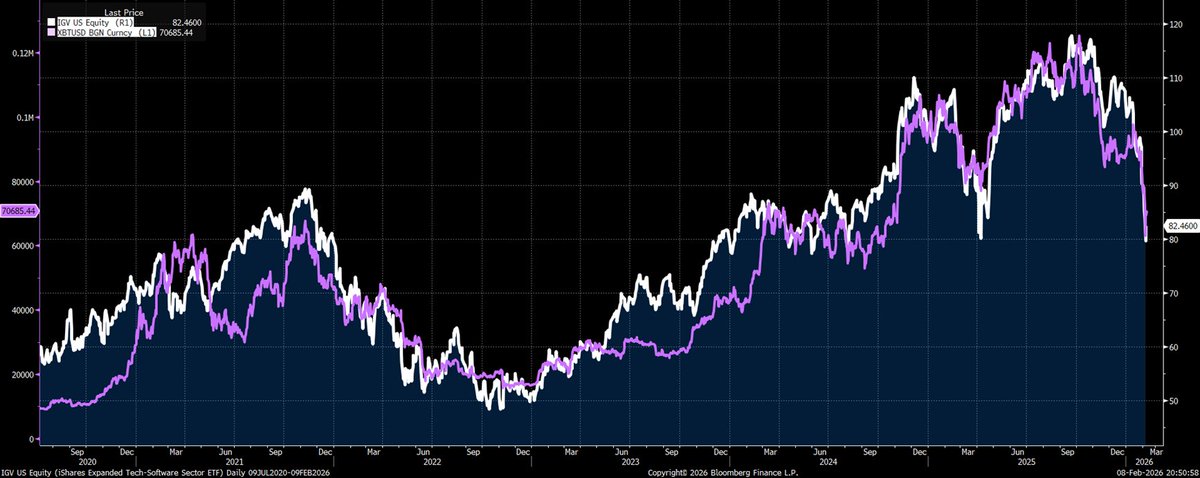
If it walks and quacks like software, maybe Bitcoin is software 🤔
Software stocks and Bitcoin have been highly correlated, and especially recently as both have crashed together
The message of the market seems to be that Bitcoin is software ...
Crypto isn’t about getting rich fast.
It’s about building a future where you control your money, identity, and creativity.
Still early. Still growing. Still unstoppable.
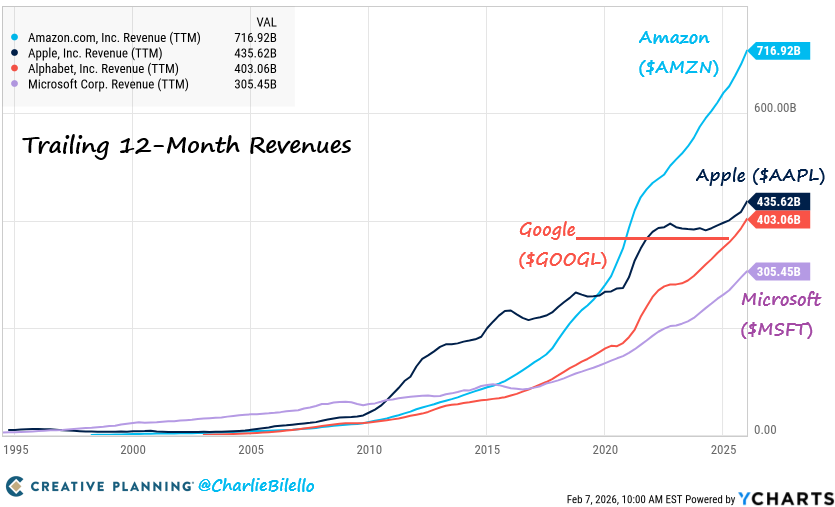
The combined revenues of the Big 4 US tech companies hit a record $1.86 trillion over last 12 months:
Amazon $AMZN: $717 billion
Apple $AAPL: $436 billion
Google $GOOGL: $403 billion
Microsoft $MSFT: $305 billion
That's larger than the GDP of all but 13 countries.
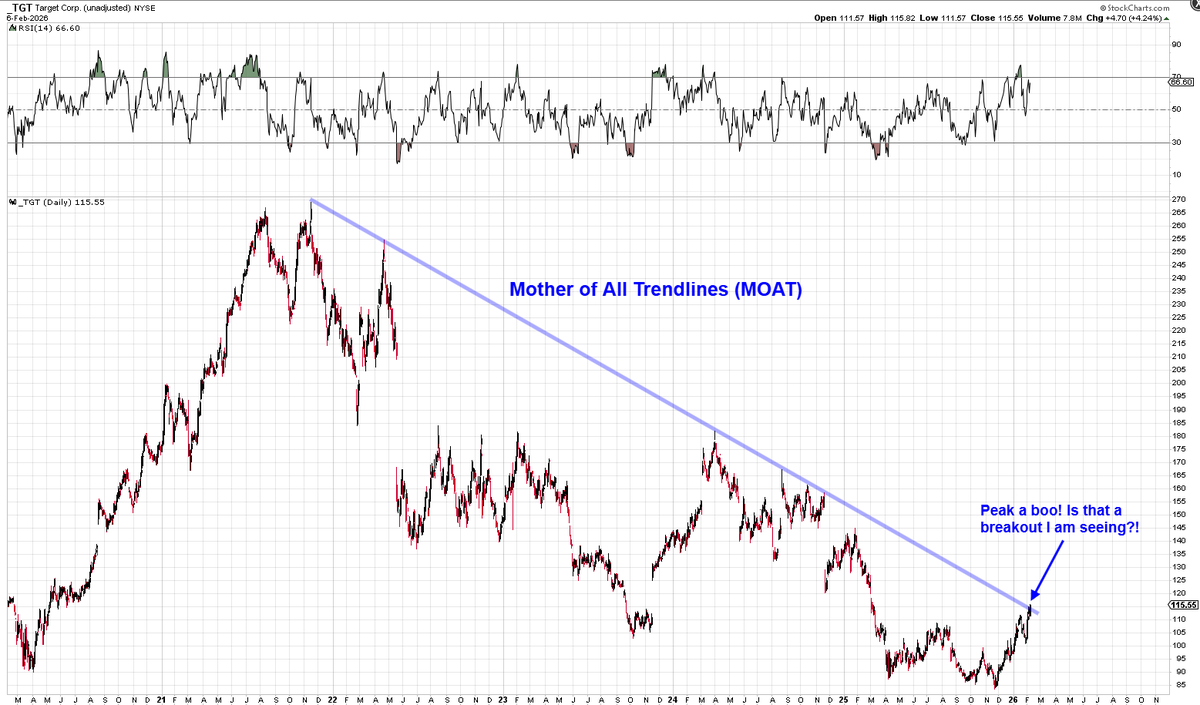
$TGT Has a chance to do something very special here..
A catch up trade for the ages! It's due.
$COST Forward P/E = 45...
$WMT Forward P/E = 44...
$TGT Forward P/E = 15!!!
It's time.
Give me $150-$160 by eoy.
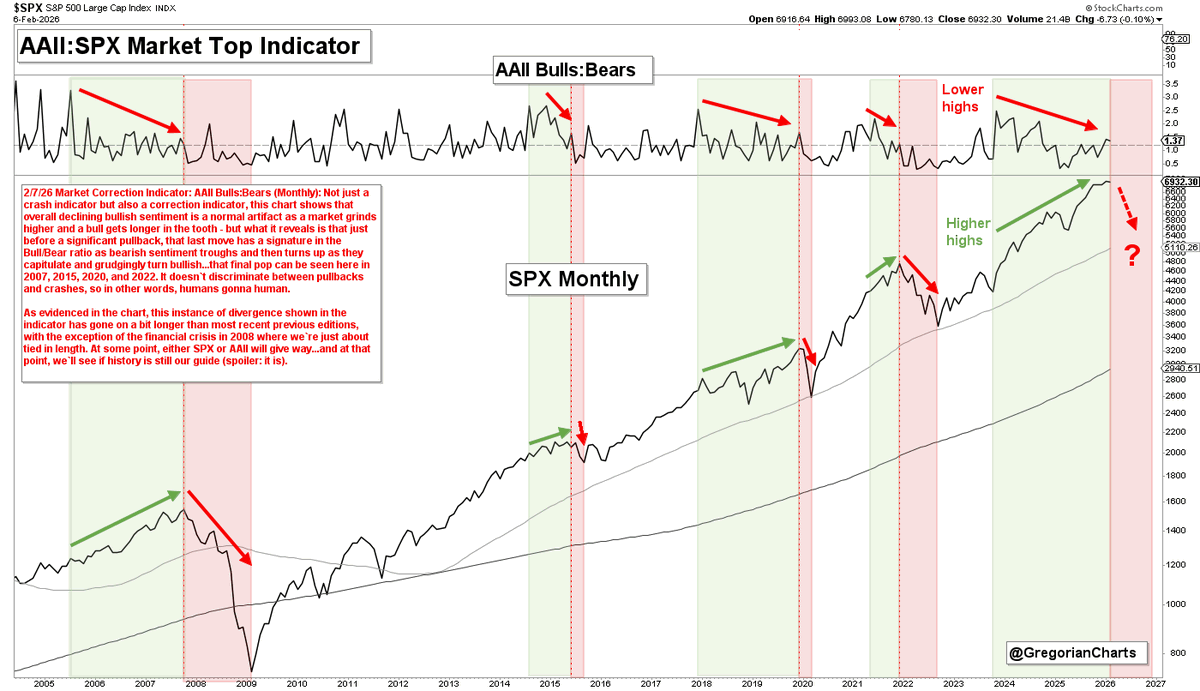
Market Correction Indicator: AAII Bulls:Bears (Monthly): Not just a crash indicator but also a correction indicator, this chart shows that overall declining bullish sentiment is a normal artifact as a market grinds higher and a bull gets longer in the tooth - but what it reveals is that just before a significant pullback, that last move has a signature in the Bull/Bear ratio as bearish sentiment troughs and then turns up as they capitulate and grudgingly turn bullish...that final pop can be seen here in 2007, 2015, 2020, and 2022. It doesn't discriminate between pullbacks and crashes, so in other words, humans gonna human.
As evidenced in the chart, this instance of divergence shown in the indicator has gone on a bit longer than most recent previous editions, with the exception of the financial crisis in 2008 where we`re just about tied in length. At some point, either $SPX or AAII will give way...and at that point, we`ll see if history is still our guide (spoiler: it is).
Momentum's picking up in the short term, but the bigger picture still isn't showing a real trend reversal.
This recent bump looks more like a short-squeeze relief rally than actual demand.. These kinds of setups usually build strong momentum before things get volatile.
Structure over narrative, always.
Markets don’t bottom when $VIX is up and the S&P is down.
That’s just stress.
Real bottoms happen when:
• S&P makes new lows
• VIX doesn’t
• Bad news stops working
Bottoms are about exhaustion, not fear.
When S&P is falling and $VIX is rising, the market is still discovering risk.
People are actively buying protection. That means fear is growing, not finished.
A bottom can’t form while:
•New sellers are still showing up
•Hedgers are still willing to pay up
•Volatility is still being bid
That’s an unfinished process.
Just a heads up...
Bitcoin has NOT produced a bullish RSI divergence on daily candles.
Every single major low during the bull market came after a bullish RSI divergence, so I think it's important to produce one again if you want a sustained & material rally.
Be prepared.