First of all, Happy Sunday. I hope it’s a well-deserved day of rest for all of you.
I said something on stream yesterday that I think is worth repeating. If you have followed me over the last decade you have heard me use this analogy many times.
As a trader, you are basically a surfer.
Right now, for the first time in a long time, the market is full of opportunity. There are waves everywhere, and there is something for almost every type of trader.
If you have been patient and have not ground yourself up into a fine dust in the bear market, this is exactly what you have been waiting for.
And yet right now a lot of people are spending more time watching what everyone else is doing. Who caught what. Who made how much. Who got there first. More than ever, the social trading apps are making this impossible to avoid.
If you are new, this is going to feel overwhelming, and your own performance is probably going to feel massively underwhelming.
When you first start surfing, you probably make the mistake of going out every single day, and there is nothing wrong with that but eventually you might realize that not every day is worth paddling out.
So you get a surf cam. You start checking the swell, the wind, the tide. You learn to recognize when conditions are actually good.
Discretionary trading is not very different.
You spend years developing systems, tools, and pattern recognition so that when the conditions finally improve, you can recognize it and take advantage of it.
And probably most importantly, when the surf is firing, nobody gets to the beach and thinks, “Damn, everyone already caught all the good waves.” Because you know there is a very significant chance that there are more coming.
You don’t need to worry about how much someone else made on the last one. You don’t need to chase their wave.
Just recognize the conditions, get in the water, and focus on catching your own.
The surf is good right now.
Enjoy it.
Simply your trading
Four questions you should ask yourself before every trade
1. What structure am I trading?
2. What level am I buying?
3. Where am I objectively wrong?
4. Where does profit taking make sense?
If you can't answer those then you probably don't have a trade yet
You have an idea
Just an important reminder and something that I need to emphasize here...the thesis on ethereum:0xd533a949740bb3306d119cc777fa900ba034cd52 atm is that the local bottom at .20 preceded our first true impulsive movement following our macro/HTF spring at .17 a few weeks earlier.
If the idea is correct, then the origin of that impulse at .20 was our BOTTOM, essentially, before new all time highs at $6+.
Yes, initial low timeframe targets are .30+ and above that .70+ as covered in recent video updates, but following those targets being met we are not expecting new lows- just some potential chop before continuation to $1+ and ultimately new highs.
SO WITH THAT BEING SAID, as we trade here at .26, just .06 above what should be our BOTTOM before $6+, DO NOT MISS THE FOREST FOR THE TREES and fail to position if you are bullish on ethereum:0xd533a949740bb3306d119cc777fa900ba034cd52 and the markets as a whole here.
DO NOT WAIT for a penny or two lower if you believe (like me) that downside is limited to 6 cents, and upside is literally 100x that.
FOR SPOT BUYS THERE IS NO BETTER TIME if the idea is correct.
Levered longs are a different story, as precise entries are more important in managing risk, etc.
BUT if you are sitting on your hands staring at CRV grinding up right now, with capital waiting to be deployed on spot ethereum:0xd533a949740bb3306d119cc777fa900ba034cd52, and you- like me- recognize the impulsive PA off of .20 and it's implications, THEN THIS IS YOUR REMINDER TO STOP SITTING ON YOUR HANDS and ACT.
As always, manage your risk, don't invest more than you can afford to, etc. But if there was ever the time to stop sitting on your hands and pull the trigger on spot CRV, that time is NOW (if you agree with the idea behind the impulsive move at .20).
Trends are easy to see in retrospect but almost impossible to identify in real time.
This 1-minute exercise will improve your chart reading:
Step 1: Take a chart. Cover the right side with paper.
Step 2: Analyze what's visible.
Step 3: Decide what you'd do. Buy, sell, size, stop. Be specific.
Step 4: Slide paper one day right. Reveal next candle.
Step 5: Record what orders would have filled from yesterday's plan. Don't cheat.
Step 6: Ask if today's price changes your call.
Step 7: Repeat until you've walked the chart forward.
Most traders will hate the result.
Because half your chart-reading skill is hindsight. This exercise cuts it out.
That's why it's so valuable.
Share your results below.
$CRV Let me be clear.
Confirmation of a breakout from the $0.22 area would completely change the chart pattern.
From that point onwards, the market would have scope for a rapid rise towards $0.32, with little resistance along the way.
Keep it on your watchlist: if the breakout were to occur on high volume, it could become one of the most interesting set-ups in the coming weeks.
$CRV
If $0.17 marked the start of the HTF impulsive uptrend, early June’s wave 1 advanced +56% to $0.2655. Wave 2 has retraced -31.68% so far, equivalent to 88% of wave 1’s length. When wave 2 retraces this deeply in an impulse, wave 3 is likely to extend. To estimate an order of magnitude for wave 3 and avoid exiting a trade too early, I apply a mathematical formula based on the Elliott Wave Principle’s equality guideline.
Let’s assume wave 4 will retrace a similar percentage to wave 2. In an impulse, wave 4 is not allowed to enter the price territory of wave 1, then the goal is to find the minimum wave 3 top that prevents wave 4 from closing back into wave 1’s territory if it retraces the same percentage as wave 2’s.
Formula used:
Wave 3 top = wave 1 top ÷ (1 – wave 2 retracement %)
With wave 1 top = $0.2655 and wave 2 retracement = 31.68%, then:
Wave 3 top = $0.2655 ÷ (1 – 0.3168) = $0.3886
This means wave 3 needs to push beyond ~$0.3886 for wave 4 to be able to retrace the same percentage as wave 2 without closing back into wave 1 territory. The attached chart illustrates this relationship visually. Wave 4s in this market often retrace more than wave 2s. Therefore, $0.3886 is a conservative target for wave 3 if this is the case. If wave 4 retraces less than wave 2, then wave 3 could top out somewhat below this level, but it’s still a good estimate.
Combining the above calculations with the chart context, and assuming (again) the HTF impulsive uptrend is already underway, wave 3 could top inside the $0.33–$0.45 supply zone, and wave 5 could take out the liquidity at $0.4578.
#CurveFinance
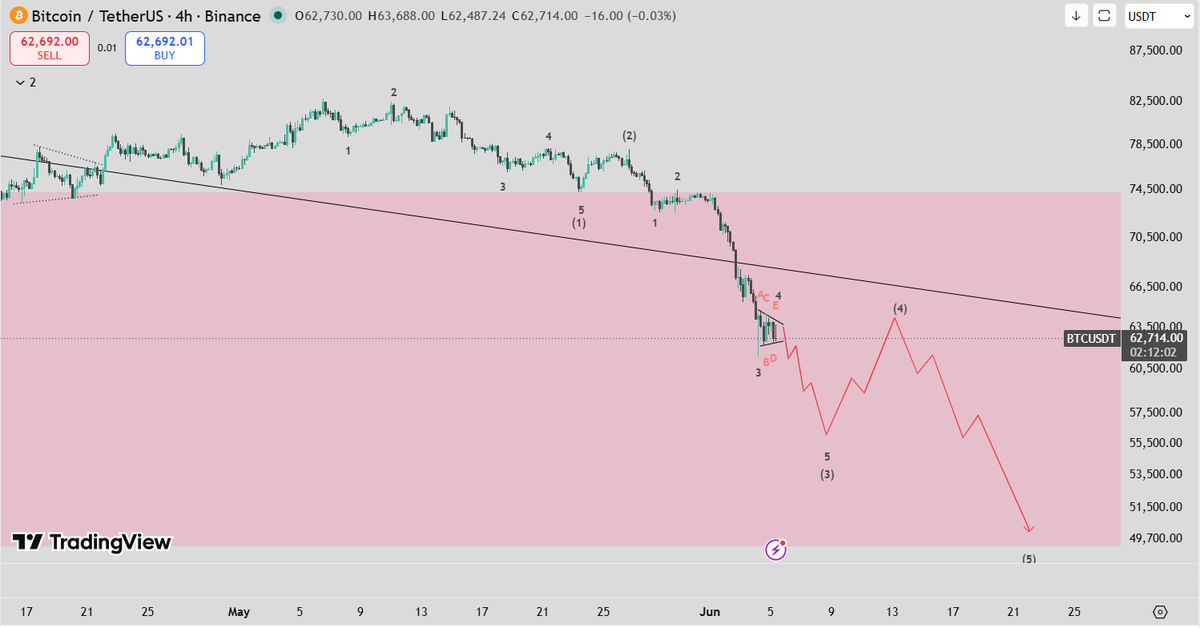
$BTC
4hr Timeframe. In my opinion, the correction has not been finalized. We are currently in 4th wave of the intermediate degree (being a triangle). Invalidation will be a move above 78,250.
#ElliottWave
The best thing about being comfortable with trading is, I don't own anything.
I have no stress, no liability, no bank or wordly obligations.
Just one laptop, travelling and stopping wherever I want and a few T shirts because I don't have dress for office.
Live wherever I want. Eventually I'll settle down but nothing else could give me this freedom.