$MSFT
Wow, now here's an image to chew on. This stock IS breaking down! Small H&Sh up top is now working. Target IS 50% lower from current levels.
#pma4tw#straponseatbelts
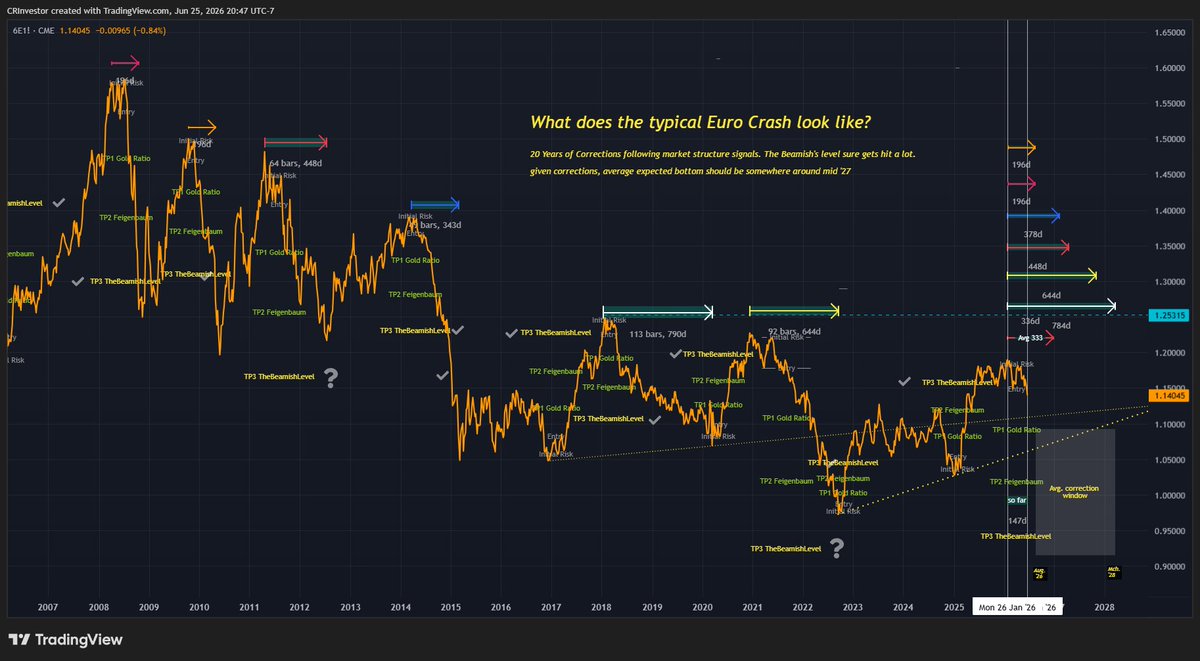
Significant technical damage has been done to our friend the #Euro of late.
Based on the past 20 years trading well defined market tops have led to some dramatic #TheBeamish level tags. Given precedent I don't think the average duration of moves is an unrealistic expectation.
USD putting in its first higher low and high on the Weekly Cycle in a very long time. Possible major bottom.
Would suggest more pressure for precious metals and bitcoin into end of year. Stocks don't care, for now,
Did you know one of the most accurate cycle top models in Bitcoin's history was built by combining over 2,500 moving averages?
The Max Intersect SMA Model is one of Alphractal's signature discoveries — built by Joao Wedson in January 2021 after running a heuristic across 2,500+ simple moving average configurations. The model identifies the SMA that intersects with the previous cycle's top and coincides with the next cycle's top — hence the name "Intersection."
Track record across prior cycles:
— 2017 cycle top: model called the top window precisely.
— 2021 cycle top: model called the top window precisely.
— 2024-25 cycle top: the actual ATH of $124,723.65 printed outside (above) the model's projected line — the first case in the dataset where the cycle top exceeded the model's structural ceiling.
Where the data currently sits:
— Current BTC price: $65,836
— Current Smart Model value: $75,584
— Previous ATH (Alert Line): $124,723.65
— BTC is currently trading approximately 13% below the model line.
What's notable about this cycle:
The last cycle's top printing outside the model for the first time raises a structural question that the current cycle will be the test case for. If the model continues to track cycle structure, the Smart Model line at $75,584 represents the dynamic reference level. If the recent ATH outside the model marked a structural change, the model's predictive utility may have shifted.
Either way, the chart will continue to be validated through this cycle, and 2026 is the validation window.
Two readings are visible:
The continuation reading: the model historically marked cycle tops with date-level precision. If the structural template holds, the dynamic line will continue to provide a reference ceiling.
The structural-shift reading: the 2024-25 cycle was the first time the actual ATH exceeded the model. This could reflect a one-time anomaly or the beginning of a structural divergence as the asset class matures.
Full chart and continuous validation: https://t.co/6vcYmhRfcp
bitcoin:native has been pricing its Bear Cycle (and mid Cycle) bottoms an EMA Zone lower every time!
Starting with the 1W EMA200-EMA300 Zone in January 2015, #Bitcoin bottomed during the previous (2022) Bear Cycle within the EMA400-500 Zone!
As a result, #BTC should now either bottom within the same Zone or a worst, move one lower within the EMA500-600. Those two Zones translate based on current prices, to a $50550 - 44250 good/upper case and a $44250 - 38500 bad/ lower case scenario.
Full description on our Telegram channel:
👉https://t.co/QC3FUeVIYv
LIKE 👍, FOLLOW ✅, SHARE 🙌 and COMMENT ✍ if you enjoy this analysis!
#crypto #trading