US equity market ownership has undergone a historic shift:
Foreign investors now own a record $20 trillion, or ~19% of all US equities.
This percentage has nearly TRIPLED since 2000.
Furthermore, passive mutual funds and ETFs hold $17 trillion, an all-time high, accounting for ~15% of all US equity ownership.
Since the 2008 Financial Crisis, passive fund ownership has TRIPLED.
Over the same period, the weight of active mutual funds has more than HALVED to $11 trillion, now at ~10% of total, the lowest since the early 1990s.
Foreign investors and passive funds are a key source of demand for US stocks.
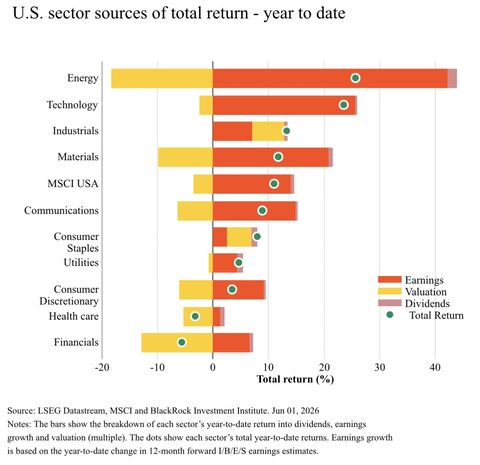
Not one, not two, but three S&P 500 sectors are testing either Dot-Com or GFC extremes. Relative to the rest of the market, Healthcare is back to March 2000 specifically. Consumer Staples = Dec. 1999. The S&P 500 Financials sector just broke March 6, 2009.
This is turning into a record no one reading this will ever see broken in their lifetime.
Stocks have gained a record first 7 days in a row since Warsh was confirmed. The previous record was Miller with 5.
So far, the market has delivered its strongest start to a midterm-year second quarter since 1950, despite entering what is typically one of the weakest periods of the presidential cycle.
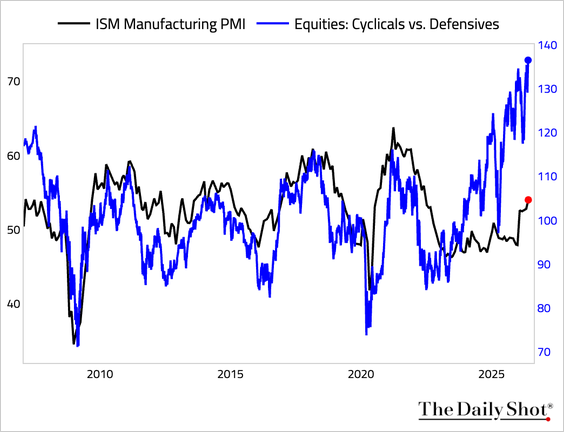
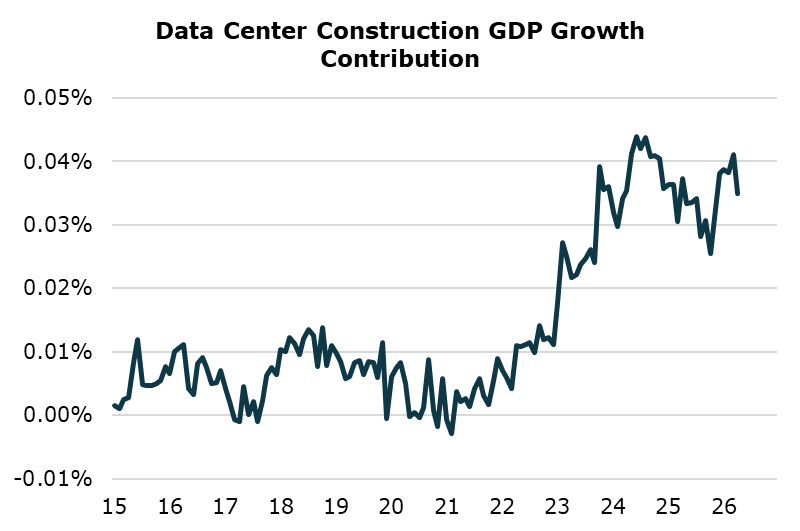
U.S. manufacturing continued to gain traction in May, with the ISM Manufacturing Index rising to 54, above expectations of 53.1, and marking a fifth straight month of expansion. Momentum across the industrial sector is firming as AI construction and CapEx flows through to economic activity.
The chart shows the correlation between the U.S. ISM Manufacturing Index and the S&P 500 index year-over-year percent change, since 2011.
@ISABELNET_SA
The S&P 500 is up 112% since the current bull market started October 2022.
Bull markets see 192% returns on average dating back to 1949.
History says there is plenty of upside ahead.