Our final day of data compilation—and daily tweets—will be this Sunday, March 7—but our work isn’t quite done. Our teams are working on several in-depth analyses of federal and state data, and we will also be publishing documentation about every part of the project.
@GlorionSenior Yes, we’re having problems - it’s an SSL certificate handshake problem with the New York Times data site - taking us a while to get fixed. Thanks for the kind words. Do not have ETA for fix yet.
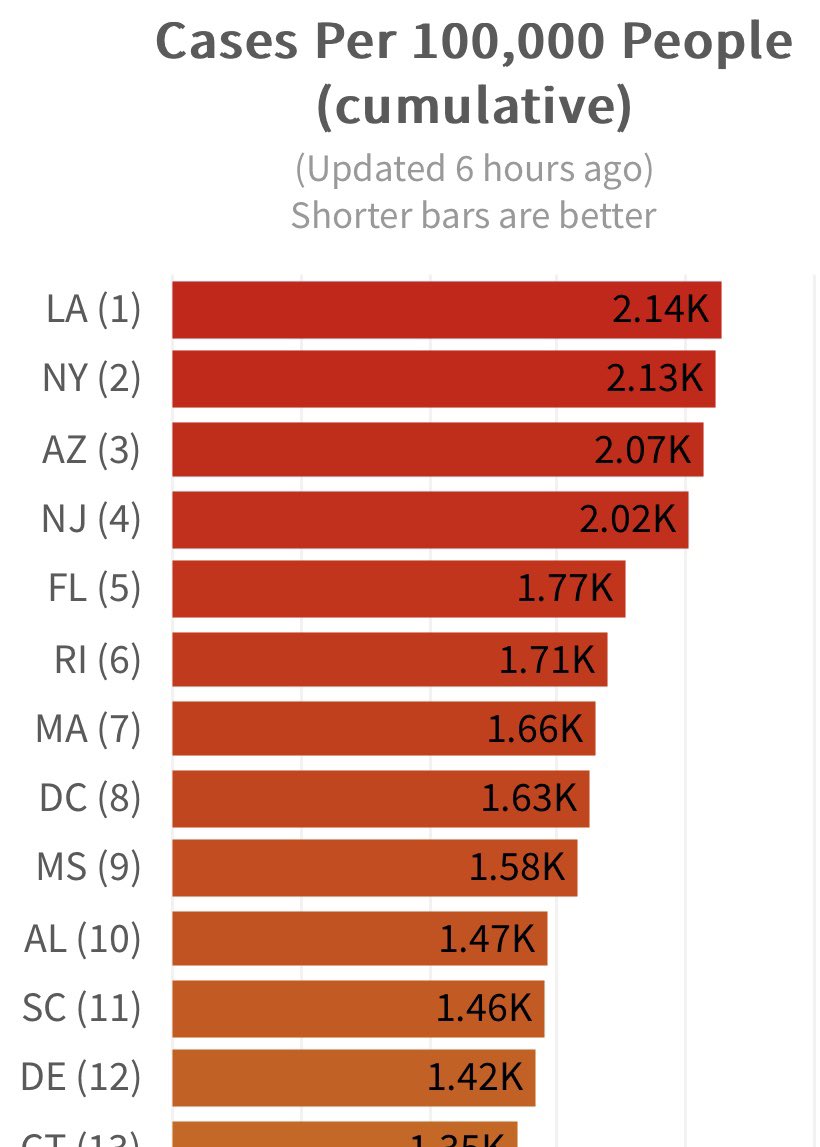
Los Angeles County is the #1 biggest county in the USA and triggered the email alert system today in both number of new cases and fatalities:
https://t.co/MJNAAeug2D
Want to calculate the risk of gathering in person for #Thanksgiving? Go to this tool built by GA Tech. If you know # of guests & the city or county, you can calculate odds that at least one person in attendance will be currently infected with #COVID19.
https://t.co/V0FxsD8ReL
A note to our data users about the reporting trends observed by day of the week. Currently COVID-19 case data reported on Fridays and Saturdays is nearly double the figures reported on Sundays and Mondays.
New report from @nytimes on the discrepancies among states reporting probable cases:
➡️ 7 states + DC (including TX & CA) do not report probable cases (i.e. positive antigen tests)
➡️ 6 states (including GA, IL & WA) report probable cases separately (not included in total)
1/
Been producing a CV19 newsletter of late about once every 10-14 days. Link below to the most recent one. Focus is on the data, not politics. Feel free to sign up if you are interested in receiving them (link to add your email at bottom of newsletter).
https://t.co/xH9rUIq6I5
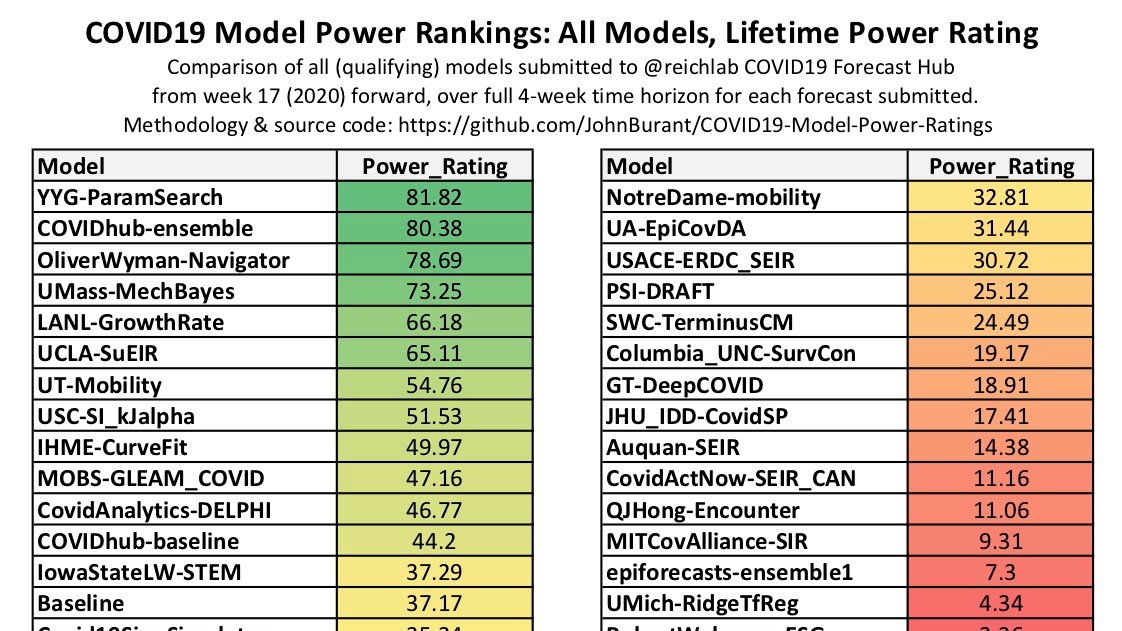
** Rating the COVID19 models **
What's the "best" (= most accurate) of the COVID19 models out there? How can we make consistent comparisons over time?
This thread discusses a (new) framework for comparing the models on the @reichlab and @CDCgov sites. 1/
@GavinNewsom California ranked 13th worst in the nation this morning by average number of daily new cases (normalized to cases-per-100,000 people so population of state isn’t a factor)
https://t.co/rlGgEXkStq
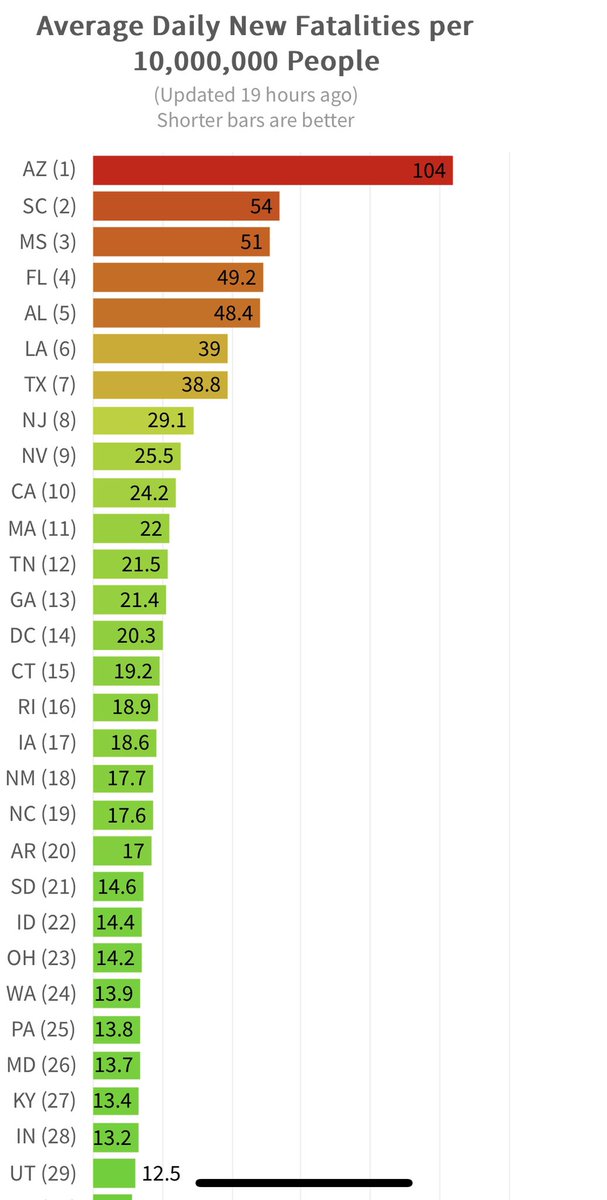
Highest average daily deaths:
▪️#1 Arizona has 107 daily deaths per 10 million people. That’s 1 out of every 93,000 people dying daily.
▪️#2 and #3 South Carolina and Florida are tied at 53 daily deaths per 10 million people. That’s 1 out of every 189,000 dying, daily.
Bad #COVID19 US Trends—
Alabama is:
4th for normalized new cases
5th for normalized new deaths
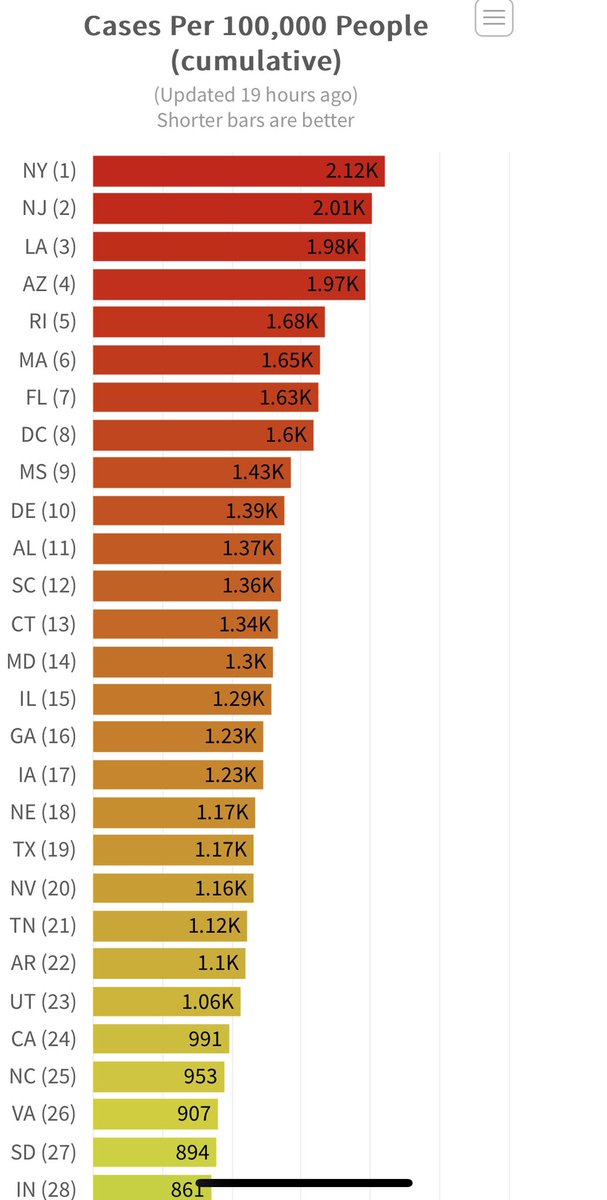
11th for normalized cumulative cases
Our normalized cumulative fatalities & fatality rates are better—#22 & #32 respectively