Want to learn to clean, manage, and analyze your data and don't know where to start? Does learning to code sound like too much of a time commitment?
We'll guide you from your first line of code to completing a project in just 4 days!
Register at: https://t.co/SfRunryDq8
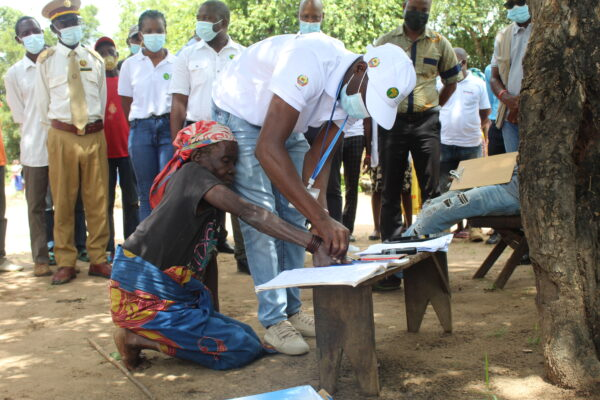
Malaria is one of the leading causes of death in Mozambique.
Databrew is assisting the BOHEMIA project in collecting and analyzing data to determine the efficacy of the antiparasitic drug ivermectin on treating malaria infection.
https://t.co/g721e8VUk4
Want to learn R but don't know where to start?
Mathematician, data scientist, and master instructor Dr. Matthew Rudd is leading a course in Barcelona in a few weeks.
Perfect for researchers and aspiring data scientists wanting to get a jumpstart in R..
https://t.co/m53PZJHgTk
Databrew is proud to announce that our data analyst Anastasiia Kostiv will be speaking at the virtual R/Medicine conference, which is taking place this week!
Anastasiia will be presenting on ‘Spatial Health Data with R Shiny’ on Thursday, August 25.
https://t.co/OudT5XAlRK
We want to prove that anyone (including you!) can learn #datascience when it is taught by instructors who care about the student experience and strive to ensure each participant's learning experience is fun, personalized, and enriching.
🗺 Find out how the @UNITAID-funded #BOHEMIAProject is mapping households, livestock, and mosquito-breeding sites using a customized #openaccess software by @data_brew.
🔗 https://t.co/yBIWdXYBwg
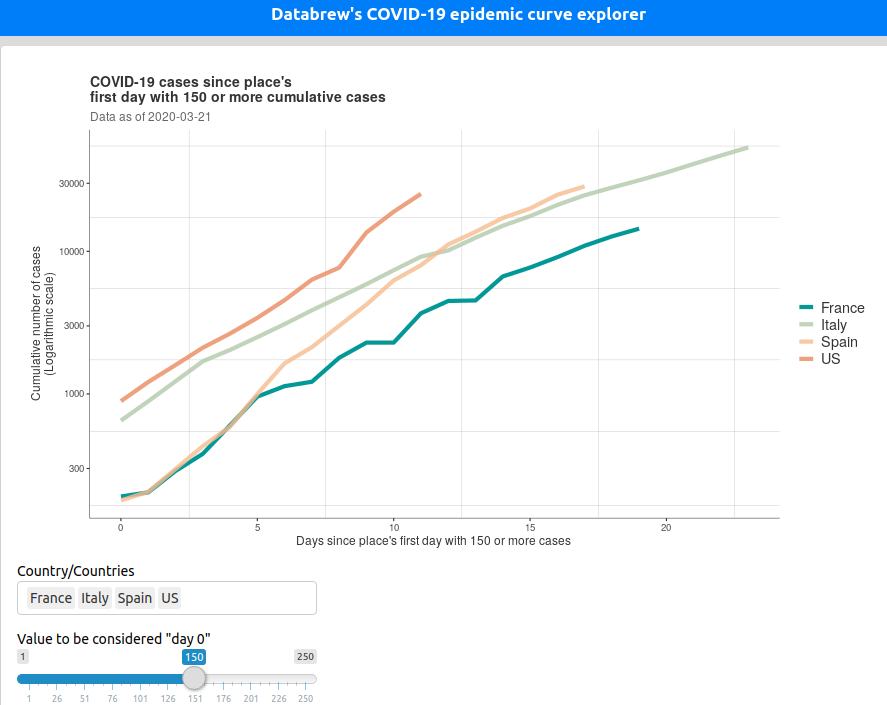
Our COVID-19 curve explorer now has:
-Options for cases and deaths
-Population adjustments for all countries
-Sub-national data for China, Italy, Spain, USA, and Canada (including population adjustments)
https://t.co/xk8Uq7DsiD
🔥 A new great #dataviz tool by @data_brew allows you to compare rising #COVID19 cases country by country on the same time scale— creating a revealing juxtaposition of various #outbreaks around the world: https://t.co/iNhgfBEhNx
When it comes to COVID-19, manual, pen-and-paper contact-tracing and interview-based geo-mapping is too slow.
We need to automate and scale. The (free and open-source) tools for this already exist. We want to help get them in the hands of the do-ers.
https://t.co/xDd8c2cUGa
Healthcare workers are at high risk of getting infected and infecting others.
When one tests positive, we shouldn't waste time asking questions about where they had been (and therefore, whom they may have infected); their phones already have the answers.
https://t.co/xDd8c2cUGa
Tracking locations means being able to replace the pen-and-paper work of epidemiological contact-tracing ("Did you stop at the store on your way home?") with scalable, automated reports.
The stakes are too high to not use all the tools we have.
https://t.co/vVLrvMaIls
Healthcare workers are at high risk of getting infected and infecting others.
When one tests positive, we shouldn't waste time asking questions about where they had been (and therefore, whom they may have infected); their phones already have the answers.
https://t.co/xDd8c2cUGa
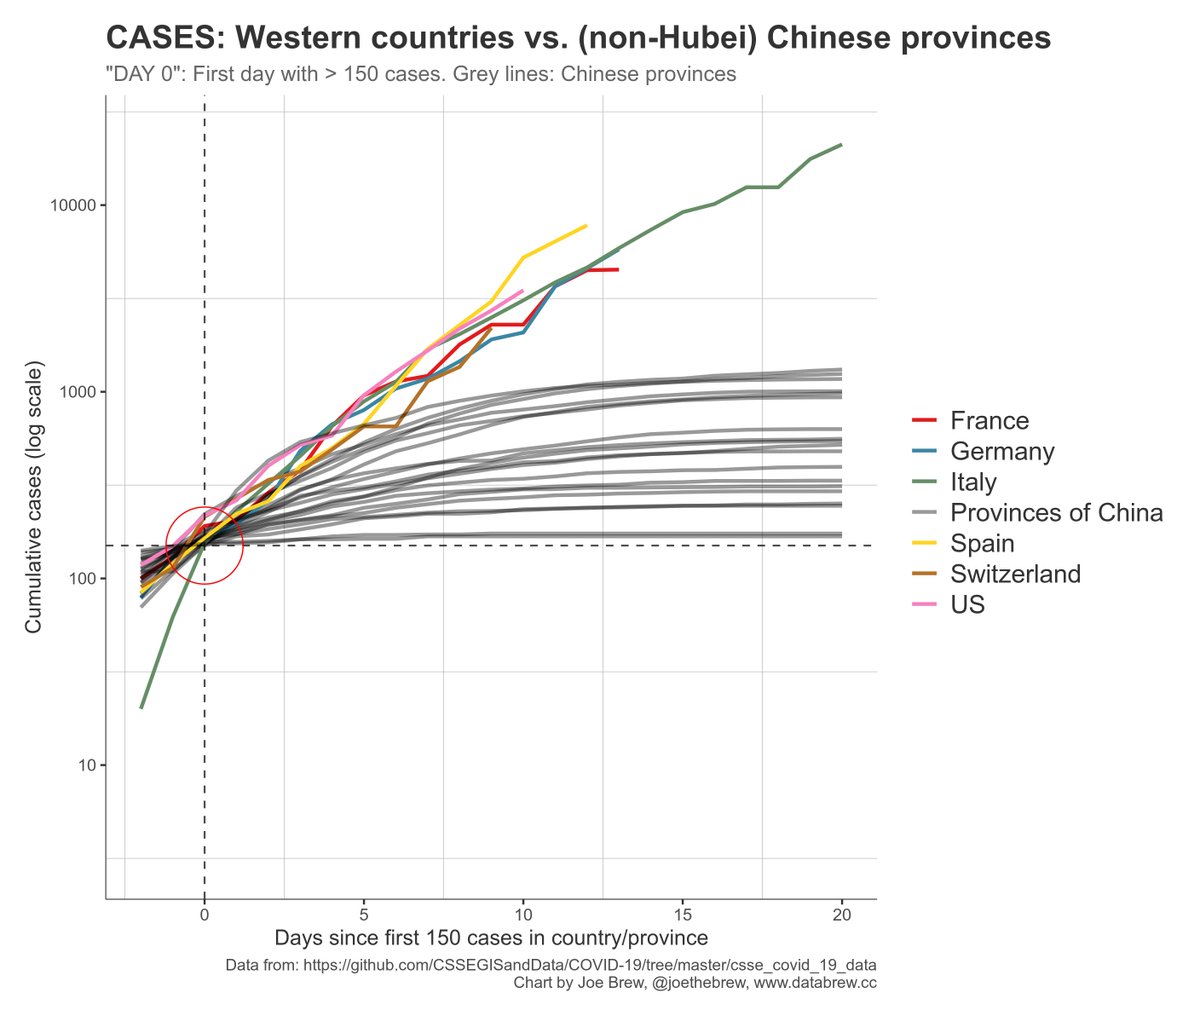
It's quite striking to compare the current outbreak in Europe and the US with the (non-Hubei) provinces of China, both in terms of cases (left) and deaths (right).
Cleary, the situation is not under control. For containment to work, more drastic measures are needed. #COVIDー19
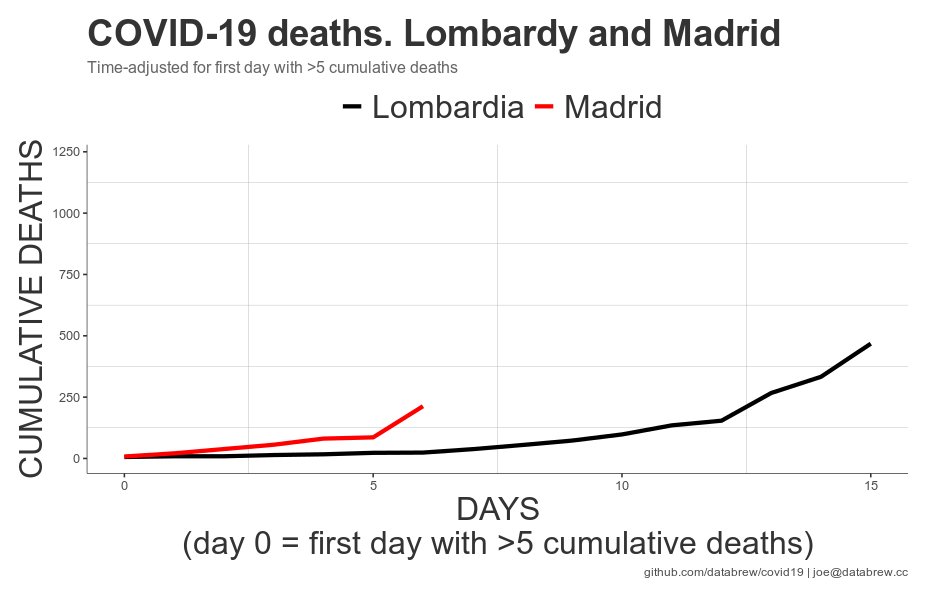
COVID-19 deaths: Spain currently on a worse trajectory than Italy.
It took Italy 13 days to go from <10 to >250 deaths.
Spain did the same in only 9 days.
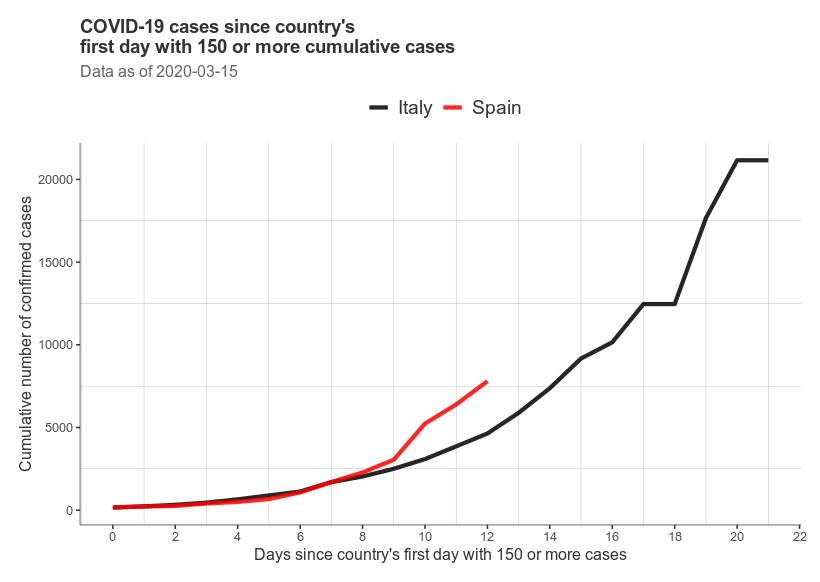
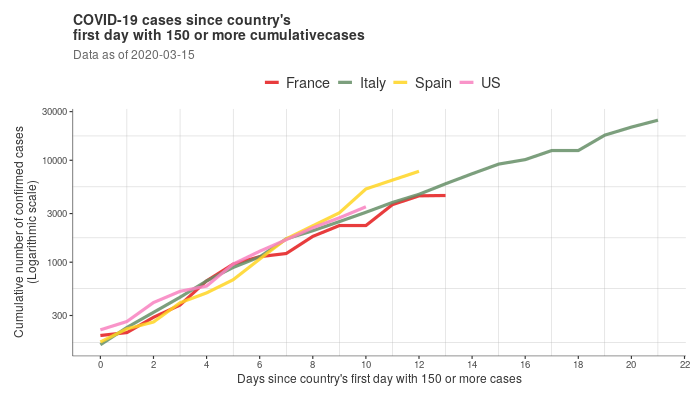
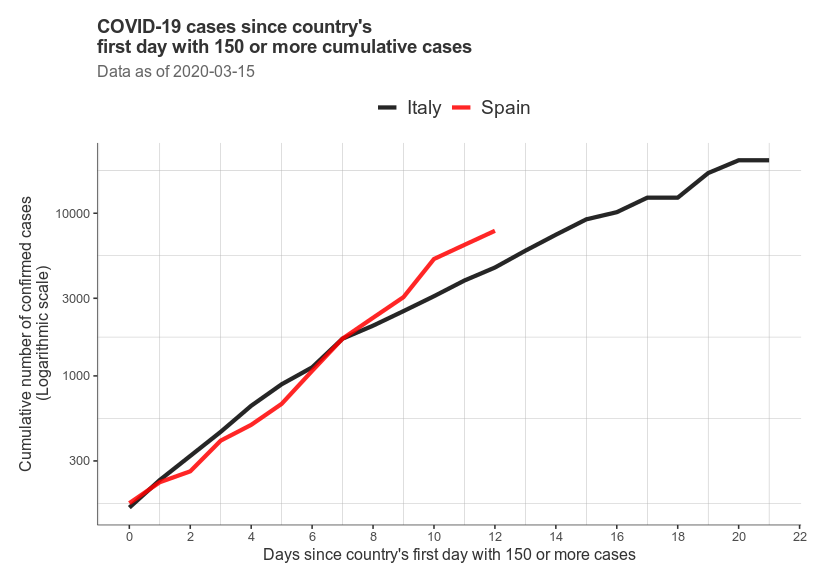
COVID-19 cases much higher in Italy, but the steepest growth trajectory is in Spain.
A. CASES: Linear scale, starting at first day w/ >150 cumulative cases
B. (log-scale)
C. DEATHS: Madrid, Lombardy: linear scale, starting at first day at >5 cumulative deaths
D. (log-scale)
If we look at deaths, instead of cases, doubling time trends are no less dire.
UK: 2.6 days
Italy: 2.4 days
France: 2.4 days
Spain: 1.6 days
Code / charts: https://t.co/7QmqARymS2