I tested 100 indicator conditions across 4,115 breakout strategies on NASDAQ and Bitcoin.
The results completely contradict what most trading courses teach.
RSI and stochastic oscillators are among the most popular indicators on the planet.
They ranked dead last.
Not just underperformed. They actively made strategies worse.
> On NASDAQ (3,500 strategies): oscillators produced negative uplift in-sample.
> On Bitcoin (615 strategies): oscillators finished last in both in-sample and out-of-sample testing.
Meanwhile, the single best-performing indicator across the entire study was one of the oldest tools in technical analysis.
Bar range relative to ATR.
High minus low compared to average true range. That is it.
When applied as a filter across those 3,500 NASDAQ strategies:
> Net profit improved by 60%.
> Max drawdown decreased by 40%.
> Win percentage improved.
> Average trade improved.
> Highest robustness index of any filter tested.
Robustness is the key word. It means the improvement you see in-sample correlates with improvement on data the strategy has never touched. The edge is real. It carries forward.
Why does ATR work when RSI fails?
Oscillators measure overbought and oversold conditions. They were designed for mean-reverting, range-bound environments. Breakout trading is the opposite. You need directional moves pushing beyond established ranges.
An oscillator reading "overbought" during a genuine breakout tells you to skip the exact move you should be taking. It is structurally mismatched to the task.
ATR measures something more fundamental: is this bar expanding or contracting relative to recent history? Is there real momentum behind this move?
That question has an answer. RSI does not.
Second place on NASDAQ: Money Flow Index (MFI). It combines price direction and volume into a single indicator.
Specific setup:
> MFI period: 14
> Smoothing: 30-period moving average of the MFI itself
> Signal: calculate the percentage difference between raw MFI and its MA
> If percentage difference is above your threshold, conditions favor a long entry
Out-of-sample results on NASDAQ with this filter:
> Net profit improved.
> Max drawdown improved by 32%.
> Average trade improved.
> Win percentage improved.
Every metric simultaneously. That is extremely rare.
For Bitcoin, the picture shifted. Volume indicators that dominated on NASDAQ flopped out-of-sample on crypto. Reason: crypto volume data is distorted by wash trading and exchange fragmentation.
On Bitcoin, volatility indicators took over. Standard deviation of close vs its moving average improved average trade by 54% and win rate by 11%.
The cross-market universal findings:
> Volatility indicators (ATR, standard deviation, true range) work everywhere.
> Oscillators fail everywhere.
> Volume works on markets with clean data. Crypto is not one of them.
The AI irony: Gemini generated all 100 indicator conditions used in this study.
The best-performing output was the simplest thing it produced.
High minus low. A decades-old concept. Still the best filter across 4,115 strategies.
100 indicators. 4,115 strategies. The ranking is not even close.
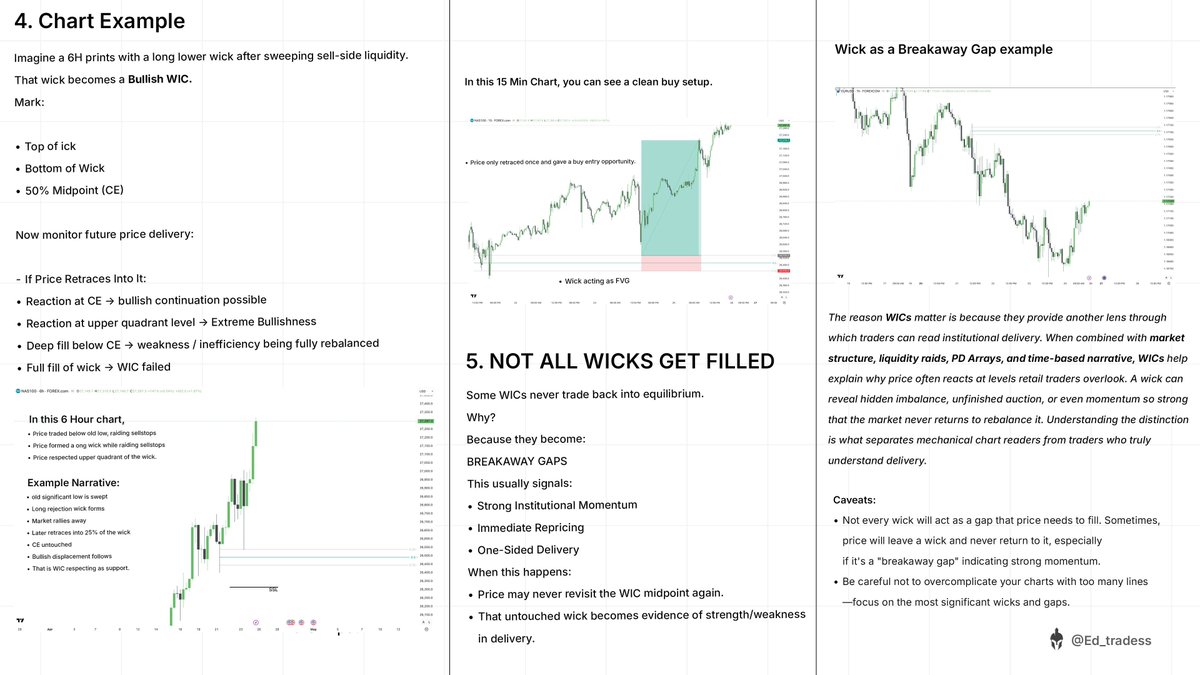
90% of the time you’ll be right on direction if you understand this 🔥
Most traders struggle to find trend and bias, they stare at candles they add lagging indicatorsvand they still end up guessing.
This image is a follow-up to the video I shared, you’re not reading candles here alone you’re reading where value is shifting.
• VAH, VAL, POC are not random lines
• They show where real business happened
• Their movement reveals true market structure
• Uptrend → Value migrating higher
• Downtrend → Value migrating lower
• Range → Value trapped between VAH & VAL
This is how you read the market without emotion, this is how bias becomes obvious.
Watch the video first.
Use this as your cheat sheet.
When trading Currency Pairs this exact part will come handy, make sure you understand it well this weekend.
In this video, I backtested every ORB15 NQ session from Monday to Friday using the same mechanical process:
• Mark the first 15 minutes of the New York session
• Identify the higher-probability side
• Wait for an iFVG confirmation on the 30s chart
• Take the trade only in the direction of the statistical edge
• Target a fixed 2R
No random bias changes.
No hindsight entries.
No chasing every breakout.
The probability map gives me direction.
The confirmation gives me execution.
And the fixed 2R target keeps the process consistent.
This is exactly how I use the Intelligent Balance Probability Map inside my Premium indicators.
The goal is not to predict every single move.
The goal is to stop trading noise and consistently focus on the side with the better odds.
Watch the full backtest and tell me:
Would you rather trade your opinion…
or the higher-probability side?
ICT Detailed Lecture 💡:
Top Down Analysis: How To Build A Complete Trading Narrative Starting From Higher Time Frame Key Level, Identifying Directional Bias, And Refining Into Lower Time Frame Entry Using PD Arrays
Took me 18 years to master this
Bookmark and Study!
🚨 Hedge fund managers are going to hate this. Someone just open sourced a system that does their entire job.
30.5% annualized returns. $0 in fees.
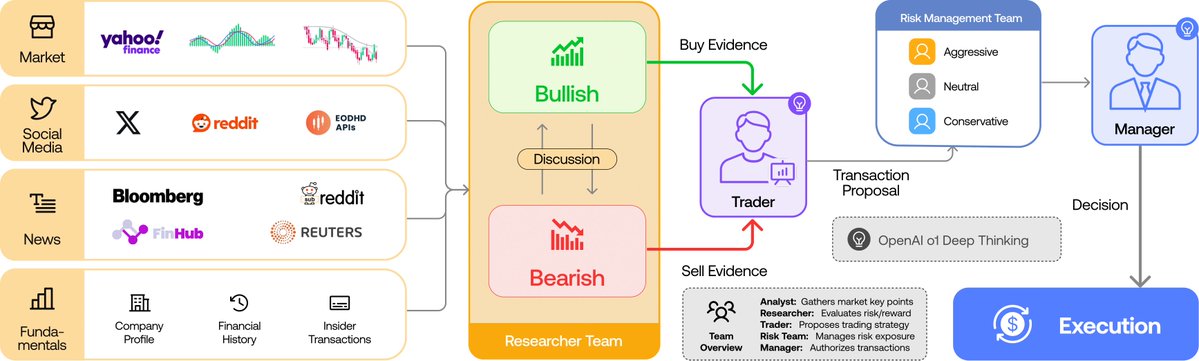
It's called TradingAgents.
Not one AI agent. An entire simulated trading firm. Analysts, researchers, traders, and risk managers. All AI. All arguing with each other before making a single trade.
No Bloomberg Terminal. No $50K data feeds. No MBA required.
Here's what's inside this thing:
→ 4 AI analysts scanning financials, news, social sentiment, and technicals
→ A Bull and Bear researcher that literally debate each other
→ A trader that synthesizes every argument into a final call
→ A risk management team that can veto any trade
→ A fund manager that approves or rejects execution
Here's the wildest part:
It beat every traditional trading strategy they benchmarked. Cumulative returns. Sharpe ratio. Max drawdown. All of them.
Hedge funds charge 2% management + 20% performance fees for this exact workflow. This is free.
100% Open Source.
Grab it here: https://t.co/VMx7hM62bT
🚨Want to learn Algorithmic Trading Strategies (that actually work)?
On June 25th, we are hosting a free workshop to help you get started with algorithmic trading with Python.
Register here (500 seats): https://t.co/uBk2SeORef
hedge funds have been running this math for 30 years. retail just discovered fibonacci retracements
andrei markov was a russian linguist studying letter sequences in 1906 - had nothing to do with markets
renaissance found his paper 70 years later, built medallion around it, told nobody
markets don't move randomly - they move in states
trending, ranging, reversing - each state has a fixed historical probability of shifting to the next
you don't predict direction. you identify which state you're in, then let probability do the rest
build a transition matrix from 10 years of price data:
trending -> stays trending 68% of the time, flips to range 21%, reverses 11%
ranging -> holds 54%, breaks up 28%, breaks down 18%
now you're not guessing - you're entering on 68% historical completion
size with kelly criterion based on that probability. take the trade when math says yes
"where is price going?" -> random
"what state am i in right now?" -> has an answer
paper is free, data is free, python to build this: 200 lines
37 years, zero losing years - that's what medallion looks like when you ask the right question
they kept you drawing fibonacci lines while they ran probability tables
Bookmark this and run the matrix yourself
Claude is now controlling TradingView live from my terminal.
Switching symbols. Writing Pine Script. Batch scanning futures. Replay trading. Drawing levels.
All autonomous. Zero clicks.
Still has rough edges but the vision is crystal clear.
I told it:
Find me every BTC futures contract with RSI below 30 and volume spike above 200%.
14 seconds later:
→ 6 contracts identified
→ Charts loaded
→ Support levels drawn
→ Pine Script backtests running
→ Entry zones marked
Didn't touch the mouse once.
Then I said:
Replay last week. Show me where your system would have entered.
It switched to replay mode. Scrolled through price action. Marked every edge. Calculated P&L in real-time.
$4,780 theoretical profit from 9 trades.
83% win rate.
Now it writes custom Pine indicators on command:
Build me a momentum oscillator that tracks whale wallet activity correlated with price.
40 seconds. Script deployed. Indicator live on chart.
Most traders are still clicking through 50 charts manually.
Claude scans 200+ in under a minute.
Finds the setups. Draws the levels. Backtests the edge. All while you watch.
This is not about replacing your strategy.
It's about executing it 100x faster.
You only need Claude + laptop + 1 hour/day.
Giving This Free for 24 hours. To get it:
1. Comment the word CLAUDE
2. Like and Retweet this post
3. Follow me @codewithimanshu (so i can DM you)
Save this post. Deploy this setup this weekend. Start testing. Scale on evidence.
This week try one thing:
• Trade #EURUSD only.
• Draw FRVP from 5pm to 1am UTC-4
• Trade only between 1 to 4am
• Fixed target 🎯 of 1:3RR.
• You can trade both Breakout Acceptance and Failed Auction Model.
Thank me later.
The NQ Midas Model:
The Model I used to pass over $1,000,000 in fundeds
Like + Repost + Comment "NQ" to receive the full Video Breakdown
(Must be 𝙛𝙤𝙡𝙡𝙤𝙬𝙞𝙣𝙜 me so I can DM)
This is what a textbook A+ setup on NQ looks like.
The direction was already defined before the trade appeared.
Today, the London Probability Map showed a 73.5% probability for the more probable LOW.
So I was not interested in longs - SHORTS ONLY.
I only needed one clean SHORT confirmation:
• Sweep of liquidity
• Bearish iFVG
• Entry aligned with the statistically more probable direction
That is it.
Historical data and probabilities define the direction.
Price action gives the entry.
Trade entry + directional edge = A+ setup.
The attached video shows the full London session execution step by step.
How much simpler would your trading become if you stopped guessing the direction first?
Quant at Jane Street kills 97 out of every 100 strategies it builds. That body count is the edge.
Not the 3 survivors. The 97 corpses.
The faster you falsify garbage, the faster you reach the one idea that isn't.
Retail runs this backwards - finds one setup, gets emotionally married to it, and rides it down 40% over six months defending it like a religion.
Run the kill-loop yourself with Horizon -> https://t.co/pDDYFGfVga
Type an idea in plain English. Horizon parses it into entry/exit logic, position sizing, risk rules.
Backtests 5 years of tick data in ~12 seconds. Runs Monte Carlo across thousands of simulated paths.
Deflates Sharpe ratio for the number of trials so luck can't sneak through. Spits out a cold verdict: dead or alive.
Kill it. Type the next. 50 ideas before dinner.
That loop cost $25K/year and a quant desk. Now it's a sentence and 12 seconds.
The edge was never having ideas. It was murdering them at scale.
Save this. Test 50. Keep 2. Kill the rest without mercy
10 GitHub repositories so good they shouldn't be free.
1. TradingAgents
A full team of AI analysts that debates strategies and executes trades in real markets. 4 analysts in parallel: fundamental, sentiment, news, and technical. Then a risk manager and an executor agent. Like having a Wall Street team working 24 hours on your computer.
repo - https://t.co/UaRcwTBIih
2. LibreChat
ChatGPT, Claude, Gemini, DeepSeek, and 20 more models in a single interface. Self-hosted. Native MCP support. Your history, your infrastructure, your data. OpenAI charges $20 a month for its interface. Here you use your own keys and don't pay a dime extra.
repo - https://t.co/WhVNyHfE5Q
3. HyperFrames
HeyGen open-sourced its internal video engine. You write HTML. The agent renders MP4. No React, no JSX, no proprietary formats. GSAP, Lottie, and Three.js work out of the box. The same HTML always produces the same file. Used in production by HeyGen, tldraw, and TanStack.
repo - https://t.co/f7n0Aj2v39
4. Fincept Terminal
A Bloomberg terminal that runs on your laptop. CFA level 1, 2, and 3 analysis. Over 20 investor AI agents that reason like Buffett, Dalio, and Soros. Over 100 data connectors. Bloomberg charges $24,000 a year. This costs nothing.
repo - https://t.co/Y21MkkfIKR
5. MoneyPrinterTurbo
You input a keyword. Out come the script, images, subtitles, music, and final high-quality video. Horizontal or vertical. No manual editing. What content creators do that they don't want you to know they use AI for.
repo - https://t.co/IXuG9rMwzX
6. Agentic Inbox
Cloudflare just open-sourced an email client where an AI agent reads your inbox and drafts responses. 100% on Cloudflare Workers. Your email never leaves your account. No external servers. No subscription.
repo - https://t.co/N0UziIIroA
7. VoxCPM2
Clone any voice with 3 seconds of audio. 30 languages. Studio-quality 48kHz. Design voices from text: "deep male radio announcer voice." No paid API. No voice samples leaving your machine. ElevenLabs charges $22 a month.
repo - https://t.co/j1wPFr2CJo
8. Flowsint
You enter a domain. The tool deploys a graph with all IPs, subdomains, emails, crypto wallets, and connected social profiles. All stored locally. Without anyone knowing what you're investigating. For OSINT, due diligence, and competitor analysis.
repo - https://t.co/qcjGwwZ21Q
9. addyosmani/agent-skills
The Google engineer who's been teaching web performance to the entire industry for 15 years published his skills for Claude Code. 23 real workflows tested in production. API design, code review, debugging, CI/CD, and frontend. Installation with one command.
repo - https://t.co/jRjpYjd8Ph
10. Nango
The integrations layer that companies pay $50k a year to rent. 700 ready APIs: Salesforce, HubSpot, Slack, Gmail, Stripe, Jira, and more. Managed OAuth. Your AI agent generates integration code from a prompt. Used in production by Replit, Ramp, and Mercor.
repo - https://t.co/fuybcYXmhh
These aren't toys. Each one replaces a paid product that you're still being charged for.
Pick one. Install it. Connect it to your workflow.
100% free. 100% open source.