📌 Deep Dive Thread
In case you missed any of my Deep Dives, you can find them all below 👇
I’ll keep updating this thread whenever a new Deep Dive comes out.
If there’s a stock you’d like to see in a future Deep Dive, feel free to drop the ticker below 👇
Save this thread to keep all my long-term setups and research in one place. 🧵
Quick reminder: $GRAB is sitting at very attractive long-term levels. 👀
Revenue continues to hit new all-time highs while the stock price remains far behind.
Eventually, price should catch up with the business.
🚨 US JOBS REPORT COMES IN HOT
NFP: +162K vs. +56K expected
Unemployment: 4.1% vs. 4.1% expected
Previous NFP: revised to +21K from -23K
The labor market remains much stronger than expected.
A hawkish signal for the Fed that could support the USD and yields while putting pressure on gold and risk assets. 👀
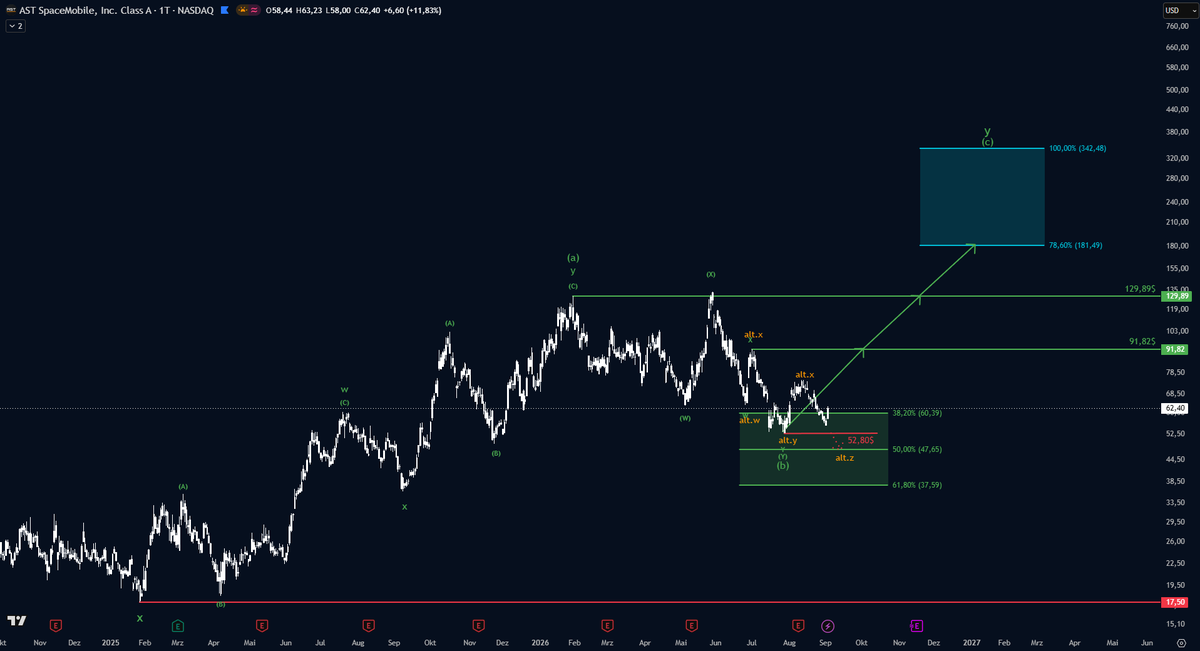
$ASTS is sitting around my long-term DCA area.
The bottom may already be in.
If we get a deeper pullback into the green zone, it would be an even better long-term buying opportunity.
No need to catch the exact bottom—DCA makes sense here.
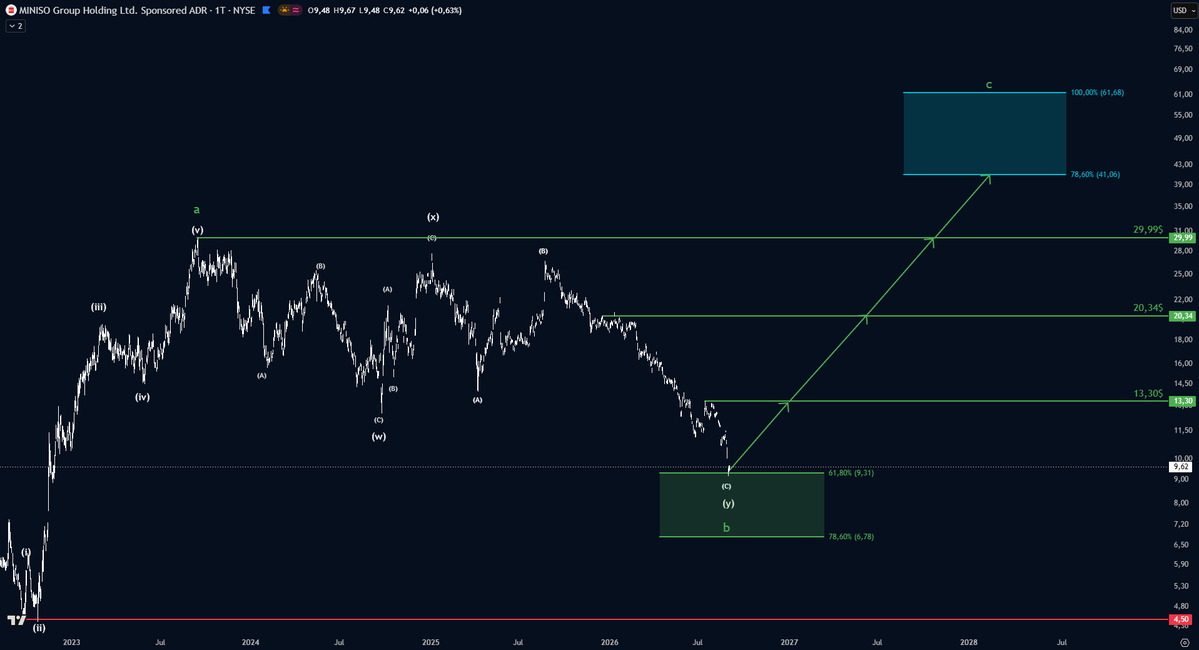
$MNSO revenue is sitting at all-time highs while the stock is down 53%. 👀
Eventually, the price should catch up with the fundamentals.
The stock is now testing a long-term DCA zone—an attractive area to slowly build a position.
$ZETA is not a bullish chart—but that doesn’t mean there’s no money to be made.
I currently see three scenarios:
1️⃣ Main scenario: Price drops into the green target box before continuing higher.
2️⃣ Price moves higher directly from here. However, with momentum weakening, I wouldn’t expect the blue target zone to be reached.
3️⃣ New lows—but first, price would need to break below the green zone and then $10.66.
You might say, “So price can go up or down?” But that misses the point.
The key takeaway is that $ZETA is currently not in a favorable risk-to-reward area. Sometimes patience is the best trade.
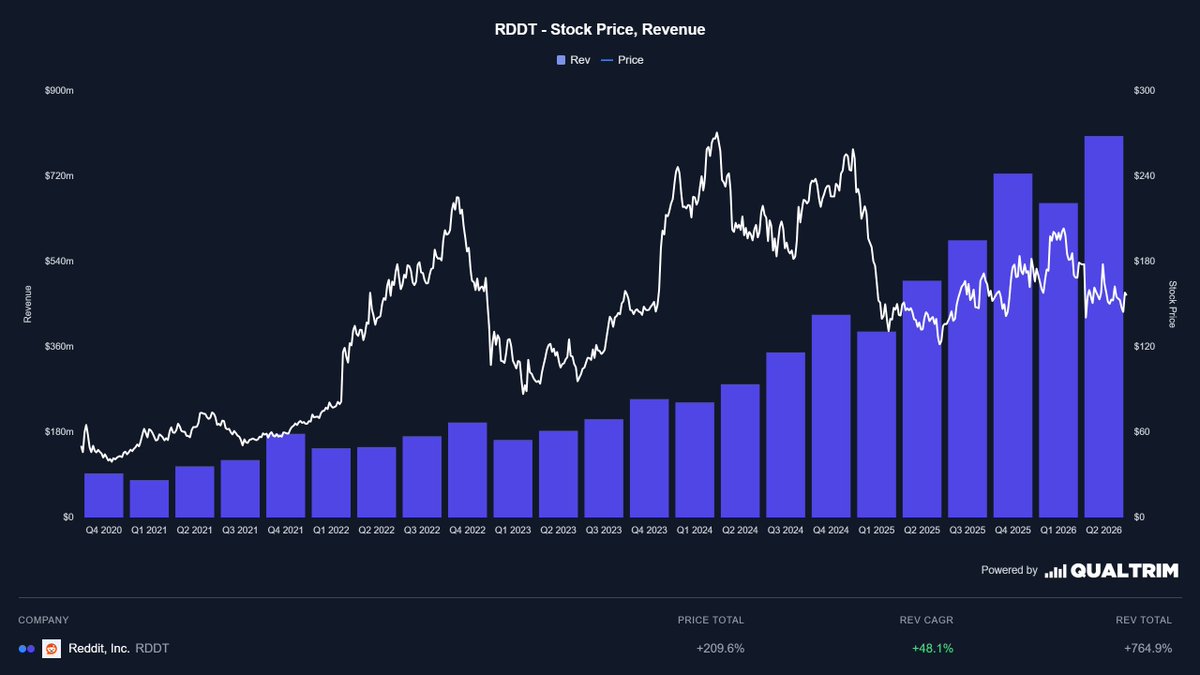
$RDDT revenue just reached a new all-time high while the stock is still around 40% below its peak.
Eventually, price should catch up with revenue growth—but markets can stay irrational longer than you think.
Patience is key here. 👀
@PauloniusW Funny thing is I wrote this scenario that you are describing only as an alternative scenario . I don’t know if you are familiar with the word probability’s because that’s how life works nothing is written in stone ;)
$ZETA is not a bullish chart—but that doesn’t mean there’s no money to be made.
I currently see three scenarios:
1️⃣ Main scenario: Price drops into the green target box before continuing higher.
2️⃣ Price moves higher directly from here. However, with momentum weakening, I wouldn’t expect the blue target zone to be reached.
3️⃣ New lows—but first, price would need to break below the green zone and then $10.66.
You might say, “So price can go up or down?” But that misses the point.
The key takeaway is that $ZETA is currently not in a favorable risk-to-reward area. Sometimes patience is the best trade.
$RDDT revenue just reached a new all-time high while the stock is still around 40% below its peak.
Eventually, price should catch up with revenue growth—but markets can stay irrational longer than you think.
Patience is key here. 👀
1/7 $EOSE DEEP DIVE 🧵
Price is inside my long-term DCA zone at $3.43–$1.26.
If the bullish structure confirms, my long-term target range sits at $25.85–$96.69—roughly +650% to +2,700% from current levels.
But the path won’t be straight. Let’s break it down