@Team2Trading Honest question Casey: what was the risk on this trade? Make 2.3k with 500$ risk is different than 5k risk. I mean, how much R was the position? 0.5 or something like 2R or 3R?
Me pergunto o mesmo @josepur. Estou em 6 projetos ao mesmo tempo, incluindo um ERP de indústria de pesca, 3 apps e 2 SaaS, e acho que estourei só 1x usando o Opus 4.7 medium effort, tudo com base em skills próprias. Mas fica a dúvida…será que tô fazendo algo errado pq geral estoura e o meu não?
@factor_members Peter, would you say your high Profit Factor is due to moving stop loss quickly and cutting losses faster (earlier than the initial SL) and also taking profits at about 2x level at least on some tranche, rather than trying to push targets higher (lower if shorts)
There is a friend of mine who day trade WIN (brazil`s index`) and Position Trade brazillian stocks with good fundamentals only, weekly chart only, stops and profit targets set at 2× the risk based on the total amount invested in the position, the remaining shares are never sold, they become leftovers that pay dividends. He's been doing that for 14 years.
Pradeep Bonde @PradeepBonde is probably one of the most intellectually complete traders I have come across. Not just as a trader but as a thinker about trading.
His blog, https://t.co/kIYl9oNech, running from 2005 to today, is deepest freely available trading education archive in existence. If you have not gone through it properly, you are leaving serious edge on the table.
The words traders casually use today -Episodic Pivot, Momentum Burst, Anticipation trade -he either coined or gave structured meaning to.
Hours spent with his content rewired how I scan, look setups and enter trades.
Three concepts in particular have shaped how I operate.
1-Episodic Pivot
This setup is most powerful in the US market. In India, circuit rules compress the repricing process vs in US would be a clean 25-30% single-day gap and continuation. I use Intraday to time entry. will detail this sometime later
2-Momentum Burst
Stocks do not trend in straight lines. They move in bursts of 3 to 5 days, gaining 8 to 40% in that window & then consolidate or reset. Idea here is to identifying the exact moment that burst is beginning through range expansion and entering just right at that inflection(Important).
The key is buying range expansion at the start and some serious allocation as you are looking for immediate feedback
3-Anticipation Trade
This is the setup I use most.
And it is the one that has produced my best results.
The anticipation trade is about entering a stock before the actual breakout fires
Basically, You are reading the setup and positioning in anticipation of the move. I use IB/NR bars,Pocket Pivot with ATR to time my entry here. Best case here is you get almost immediate feedback and SL can be extremely tight and hence position size can be big. It has low win rate but extremely rewarding
https://t.co/EF6RxiiKDi
Watch this to understand
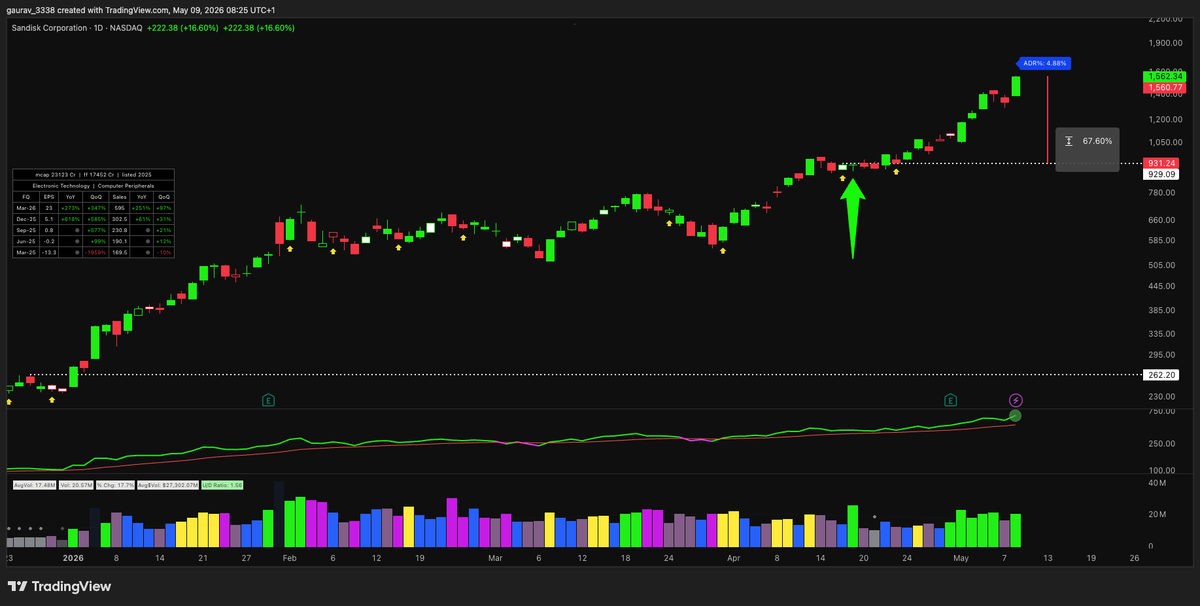
This is how I identified $RKLB $SNDK, SCI, CUPID and several other names that made significant moves.
Here is what I would suggest: allocate two dedicated weekend days- minimum 10 to 12 hours of focused time. Go through his blog on https://t.co/kIYl9oNech. Watch every public YouTube video. Build your own synthesis of his three core setups and how they interact.
Do the work. The archive is sitting there.
@factor_members This privacy coin crypto ZEC chart, for some reason, make me believe there is a buy opportunity, I just don't get to find any pattern here. Weekly and Daily chart. What do you think? No pattern, no trades, but, is there a pattern we can call on this daily structure? Maybe some kind of cup & handle, which I'm not very used to trade. Maybe we can call it a pullback on a chair with ottoman breakout?
One of the greatest investors of all time, William O’Neil, breaks down how he actually read a weekly chart.
In just 7 mins, he covered the things most ignore:
-Base patterns
-Exact Entry Zone + 10 week EMA
-Earnings strength
-RS
-Progressive exposure
This is how you train your eyes
My guest today is Paul Tudor Jones (@ptj_official), one of the greatest macro traders of all time.
He correctly predicted the 1987 stock market crash and shorted the Japanese bubble in 1990. For over 40 years, his flagship fund has had a negative correlation to the S&P 500. 100% of his returns are alpha.
He says today's market has so many similarities to 2000, "the easiest bear market I've ever seen in my whole life."
He makes the case for going long dollar-yen, why Bitcoin beats gold as an inflation hedge, and why he was wrong about Warren Buffett.
But what I'll remember most from this conversation is Paul's zest for life. He's 71 and still wakes at 2:30 every morning to trade the London open. He works out for two hours a day. He walks with his wife every evening. He travels the country chasing peak spring and peak fall. He's so excited about the songs picked for his funeral that he wishes he could be there to hear them.
Paul has lived five lifetimes in one. He's one of the most entertaining and interesting people I've met, and the conversation will leave you searching to be as passionate about what you do as he is about what he does.
Enjoy!
Timestamps:
0:00 Intro
1:00 The Kindest Thing
13:19 Trading vs. Investing
17:33 Lessons from Warren Buffet
22:24 The Existential Risks of AI
29:54 The Nature of Trading
31:46 Bitcoin
35:55 Bubbles
42:08 A Day in the Life of PTJ
46:00 Information Overload
47:07 Passion for Markets
50:49 The Robin Hood Foundation
54:18 The Workless World
56:03 Journalism
1:00:00 Principal Components of a Great Life
1:05:06 Kill Them With Kindness
If you are interested in @Deepvue this video gives a great overview of the platform and how it can save you time
✅ Quick Start Guide
✅ Top Screen Presets
✅ Deepvue AI Features
✅ Theme Tracker & Dashboard
https://t.co/WwhuZzUsGT
I just published a video on my full trading routine.
✅ Favorite Screens to use
✅ Finding Leading Themes
✅ How I Build a Watchlist
Check it out here 👇
https://t.co/j90BkLgsON