One thing to consider if you use index proxies to help you understand the mkt environment - they are just proxies. The SPY tracks 500 stocks, the QQQ 100, the DIA 30, the IWM 2000, the MDY 400. There are many occasions where a small handful of stocks will basically prop up the index and mask what's going on under the surface. This can be a bit confusing, as the index looks "healthy", but trades just aren't working and things under the hood are less clear.
It's for this reason I take a "weight of evidence" approach - realizing that no one indicator or proxy will tell me everything I need to know to make an informed decision. Some of the things I look at:
1) Index proxies - what is the trend of $IWM $MDY for mid/small, and $DIA $QQQ $SPY for large cap?
2) Breadth - how many stocks are hitting 10 and 20-day new highs vs new lows? This tells you about participation in the trend.
3) Sector RS - which sectors and industries are leading the mkt? If the top 5 sectors are things like industrials, energy, materials, healthcare, etc, that's a sign that it's not a "risk on" growth/PE expansion kind of market. Interest rate environment affects this on a macro level.
4) Setups - how many of my setups are out there in the right sectors and mkt caps? I mostly trade mid and small cap tech and consumer. That's not to say I don't trade other things, but these tend to be the growth oriented and speculative sectors where some of the biggest moves originate. If I don't see either a bunch of flag poles being built from expansions upward and/or flags being built from the subsequent compression, then that's a good sign the mkt isn't quite right.
5) Positions - how are my positions acting? If I'm getting stopped out repeatedly, that's not good. If I'm getting immediate follow through on most of my trades, that's a good thing.
These data points aren't static - the mkt is constantly ebbing and flowing. My job is to evaluate and assess these different things to determine what my odds of success are. It takes time and experience, but you need something that tells you when to be aggressive and when to be defensive. The market is driven by cycles - methods that work in some environments are out of favor in others. Like @ivanhoff says - if you do the same thing in the mkt, you are guaranteed to get different results. This just speaks to the fact that the mkt is ruled by cycles and you need to understand when your setups work and under what conditions.
Your trading strategy needs to be built around some kind of mkt phenomenon that occurs often enough and reliably enough to give you a positive expectancy over time. The main two premises I trade around is that the mkt goes through phases of expansion and contraction and that a trend in motion tends to stay in motion.
The first leg up of the trend tends to fulfill both of these - the trend kicking into motion and the strong expansion of price upward. This isn't something that I'm anticipating or guessing about - it needs to be there already. This shows some kind of strong demand for the stock, based on news or fundamentals or sector theme or whatever it might be. I don't care usually (except maybe in regards to post earnings drift, which is a highly studied phenomenon).
The second part of the equation is the contraction after the expansion. I'm looking for something that was going 100mph and is now going 10mph. Something with an ADR of 10% that's now compressed down to 5% - like a spring that's coiling and ready to uncoil. I want a minimum of one down or tight day - preferably 3-5. This is the setup - setup does not mean buy. Setup means watch.
The last part is the trigger - the call to action. This is the event that would cause you to put money at risk, granted the first two considerations are met. My call to action is an expansion (remember expansion, contraction, expansion?) of price and volume. I want a trend that was in motion, that paused for a few days, to continue it's motion. For me this is a breaking of the upper bollingerband (15m BB for 1-2 day pauses; 60m BB for 3-5 day pauses) on strong volume buzz. Again, I don't anticipate this. I have zero clues which stock on my "watchlist" will actually give me this trigger on any given day. Frankly I don't need to know or what to know. All this does is introduce my own personal bias, which the mkt gives zero fucks about. I want price and volume expansion to be the only bias I have for the day. The mkt's opinion is all that counts.
And that's it! Simple, but not easy. Do all of these steps guarantee success? On a trade by trade basis, no. I don't have a clue as to distribution of wins and losses or which ones will be winners vs losers on an individual trade. No idea. But on a macro level, over a series of 10 or 20 or 100 trades? Yes absolutely. In the right mkt context, this method will put you in the fastest moving names with the least amount of risk at the point of least resistance. Then it's just a matter of risk and position management at that point.
This is my method in a nutshell. After 23 years in the trenches, making all of the mistakes one could make, studying the greatest traders of the last 100+ years, distilling their wisdom down to the simplest, most repeatable form that I could engineer.
The key things I care about when selecting specific stocks to buy:
1) Volume and price expansion - I want to see powerful volume and price action at the pivot - no limp dicks (sorry to those with ED problems)
2) I want compression before the breakout - at a minimum, I want the 15m BBW to be less than the stocks ADR for 1-3 day pauses or the 60m BBW to be less than the ADR for 3-5 day pauses. If it's sloppy and loose like your mom, then I'm not interested. I don't care how good her sugar cookies are.
3) I need a solid reward to risk situation - asymmetric opportunities - where I enter and place my stop has to give me an advantage mathematically. If the ADR is 6% and my stop is 10%, that makes zero sense.
3) I prefer mid and small cap tech - I skip most biotechs unless they have some kind of fundamentals (which is rare) - but I try to determine the theme the mkt is pushing higher
4) Mkt context - the better breadth and trend are, the higher my odds are - my aggressiveness is directly linked to my feelings of mkt context and how well my positions are progressing
Last week we set ChatGPT up with a real $50K portfolio
This week, we met with AI experts including the creator of a ChatGPT algorithm that returned 400%
On Monday, ChatGPT will begin trading that $50K portfolio based on the learnings that we found
Here's how to follow along🫡
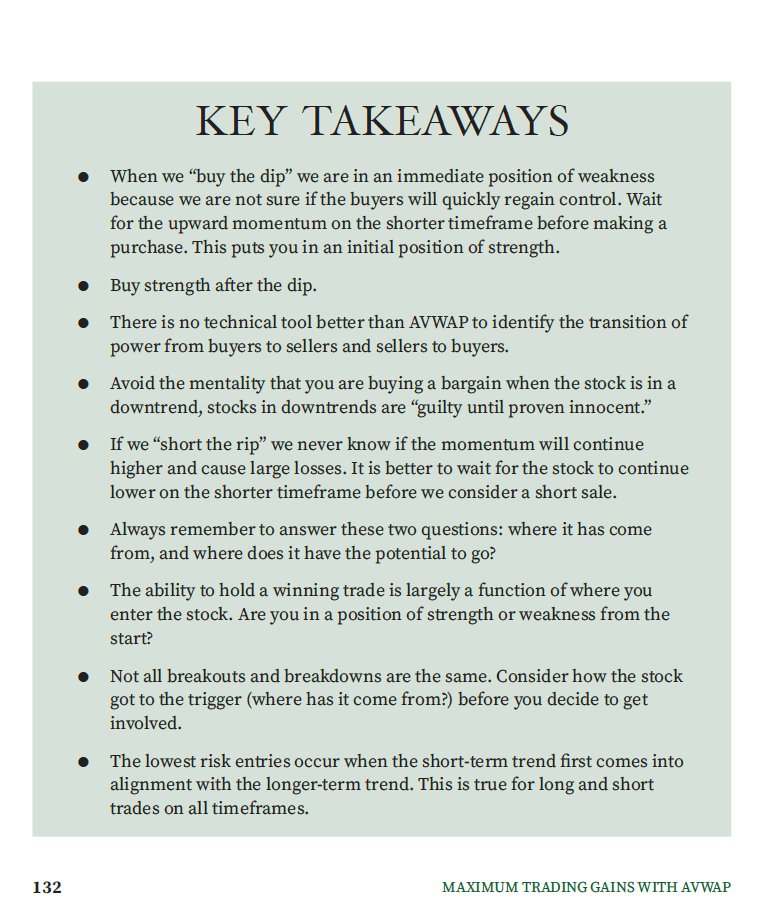
1- Don't buy the dip
2- Don't buy the breakout
3- Buy strength after the dip when the ⚓️VWAP from previous high is taken out, it tells us with 100% certainty the buyers are in control
$SMH DAILY
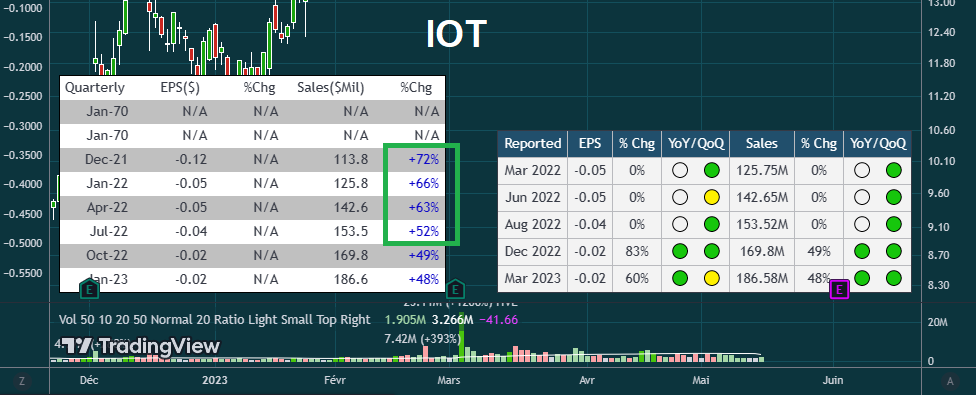
Just Updated the EPS & Sales Script to display more %variation lines on Sales for IPO Stocks using another built-in function. Now you can access more historical data :)
https://t.co/BbbeNJqJWT
2) The very good chrome/edge/brave extension of @HuskyTrader which can display either SeekingAlpha or Zacks data. But also ADR, Rel Vol, Inst Own, Short Interest:
https://t.co/nlLBJocrJK
@DumbleDax @1charts6 @davidbrezzy Thanks! I’m looking at the code now and you were the original author! You rock. Thank you. I’m reviewing my charts and you are the author of many indicators haha. Nice to find your Twitter handle. ✌️I haven’t published the copied and edited version and have no intention to do so!
@1charts6 @davidbrezzy I looked for the tweet you are referencing but couldn’t find it 😩 I like your addition of surprises in the table. Here is my current version, would you be willing the share how you coded the surprises into the table?
The 2020-2021 bubble trained some investors to think trimming is always a bad idea if a firm is fundamentally executing.
No matter how extended a multiple gets.
While fundamental execution is vital to any successful investment.
Valuation still does matter. A lot.
I have a college degree
But I’ve learned more about investing from reading twitter threads than I did in school
Here are 10 twitter threads that will make you a better investor: