How to find leaders before they go parabolic:
My favorite swing trades are in stocks I call the "grinding leaders that can become parabolic leaders".
Grinding leaders = stocks grinding up <10% a month across longer timeframes (months)
Parabolic leaders = stocks making a 50%+ parabolic move within a very short timeframe (1-2 weeks)
Join strength during the grinding phase, pre-parabolic move...here's how to find them:
Use a screener (I use finviz), and filter by:
- price above SMA20
- price above SMA50
- price above SMA200
- performance month: up 5% to 15%
- performance quarter: up 20%+
- RSI(14): 55-70ish (optional, but avoid already insanely overheated names above 80 RSI)
- average volume: over 500k
- market cap greater than $300M (or $2B+)
Optional catalyst layer...this is the real alpha!!
After the scan, I manually look for:
- hot theme exposure (ai, robotics, defense)
- earnings acceleration
- recent news
- sector rotation
- big partnerships
Few names sticking out to me:
$SATS
$IRDM
$FLY
$EBAY
$IBKR
...stay tuned for deep dives.
💙Luc
I promise this will be the best 20 min you spend today! Robotics: Endgame, the sequel to my last year's Sequoia AI Ascent talk, "Physical Turing Test". I laid out the roadmap for solving Physical AGI as a simple parallel to the LLM success story. Be a good scientist, copy homework ;)
And stay till the end, more easter eggs and predictions for your polymarket!
00:30 DGX-1 origin story at OpenAI, I was there in 2016 signing with Jensen and Elon. Heading to the Computer History Museum!
01:42 The Great Parallel
03:31 Robotics, the Endgame
03:39 Why VLAs fall short
04:32 Video world models as the 2nd pretraining paradigm
06:09 World Action Models (WAM)
07:46 Strategies for robot data collection and the FSD equivalent to physical data flywheel for robot manipulation
11:06 EgoScale and the Dexterity Scaling Law we discovered recently
14:00 Physical RL: bridging the last mile
15:39 DreamDojo: an end-to-end neural physics engine for scaling RL in silico
17:00 Civilizational Technology Tree and my predictions for the near future. Spoiler: it's closer than you think.
Thanks to my friends at Sequoia for inviting me back to AI Ascent this year! I had a blast! Last year's talk is attached in the thread if you missed it.
The 9/21EMA crossback continues to be one of my favorite areas for momentum returning to a leader.
You just needed to recognize the character change and catch a piece of the trend.
+50% on the underlying in 12 trading sessions, right off the 9/21EMA crossback.
Chart: $MU.
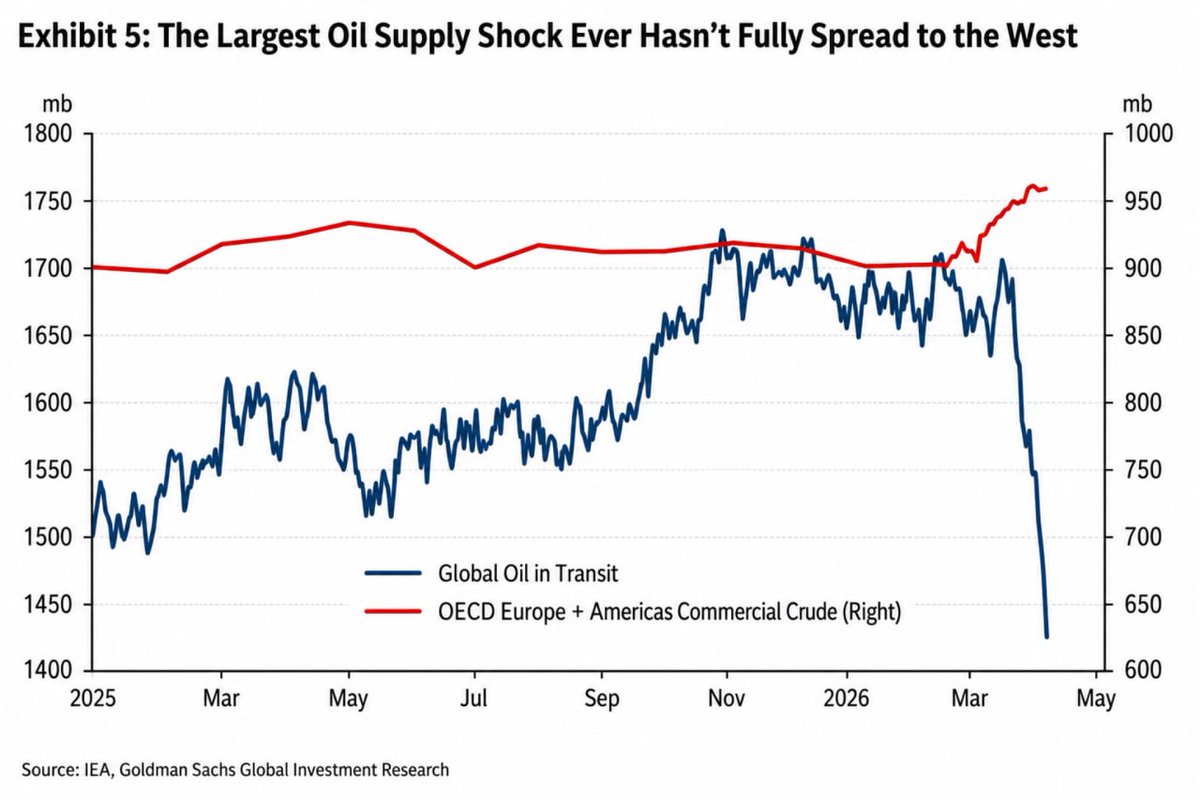
⛽️ The West hasn't felt the full force of the oil shock yet, but the ripple effects are already visible
📉 This chart reveals a critical insight: The oil shock isn't initially felt in prices. It's first felt in the barrels that never reach their destination.
🚢 The Blue Line: Global Oil on Water
This represents oil currently being transported by tankers between producers and consumers.
When this line suddenly plunges, it indicates a serious disruption to the physical oil supply chain. Simply put, the oil that should be on the water is gone. This is always where the trouble begins for the physical oil market.
🛢 The Red Line: Commercial Crude Oil Inventories in Europe and the Americas
Interestingly, this line hasn’t dropped significantly yet. This shows that Western nations are currently relying on existing reserves, alternative routes, and emergency management to delay the main impact.
Think of it like a dam where the inlet water has been cut off, but the city doesn't go thirsty immediately because the reservoir is still full.
🧠 The Hidden Danger
Many believe a full-blown crisis only occurs when Western gas stations go empty. But the oil market doesn’t work that way.
The barrels that aren't on the water today won't be in the storage tanks tomorrow.
This delay is what makes the crisis so dangerous. The market may appear normal for a time, but underlying pressure is building.
⚡️ The Domino Effect
If the red line (inventories) also begins to fall dramatically, the situation will escalate from a geopolitical concern to a real, tangible shortage.
This won’t just impact oil prices. It will cascade through:
⛽️ Gasoline and Diesel Prices
🚛 Transportation Costs
🌾 Food Inflation
🏭 Production Costs
🏦 Central Bank Decisions on Interest Rates
The shock is on its way. The data shows it. It's only a matter of time...
https://t.co/fOE5wRT8FJ
I gave a mini masterclass on the Parabolic Shorts setup in an episode that just dropped on @chartfanatics & @Wordsofrizdom .
If you wanna have an A-Z way of how to trade things like $SMCI, $MSTR, $SLV, etc, I recommend watching the full episode, it's full of nuggets
This strategy is a setup that I've used since my early trading days, and it's great both for quick injections of capital into the equity as well as, even more importantly timing your partials if you're already on the long side!
Hope you enjoy!
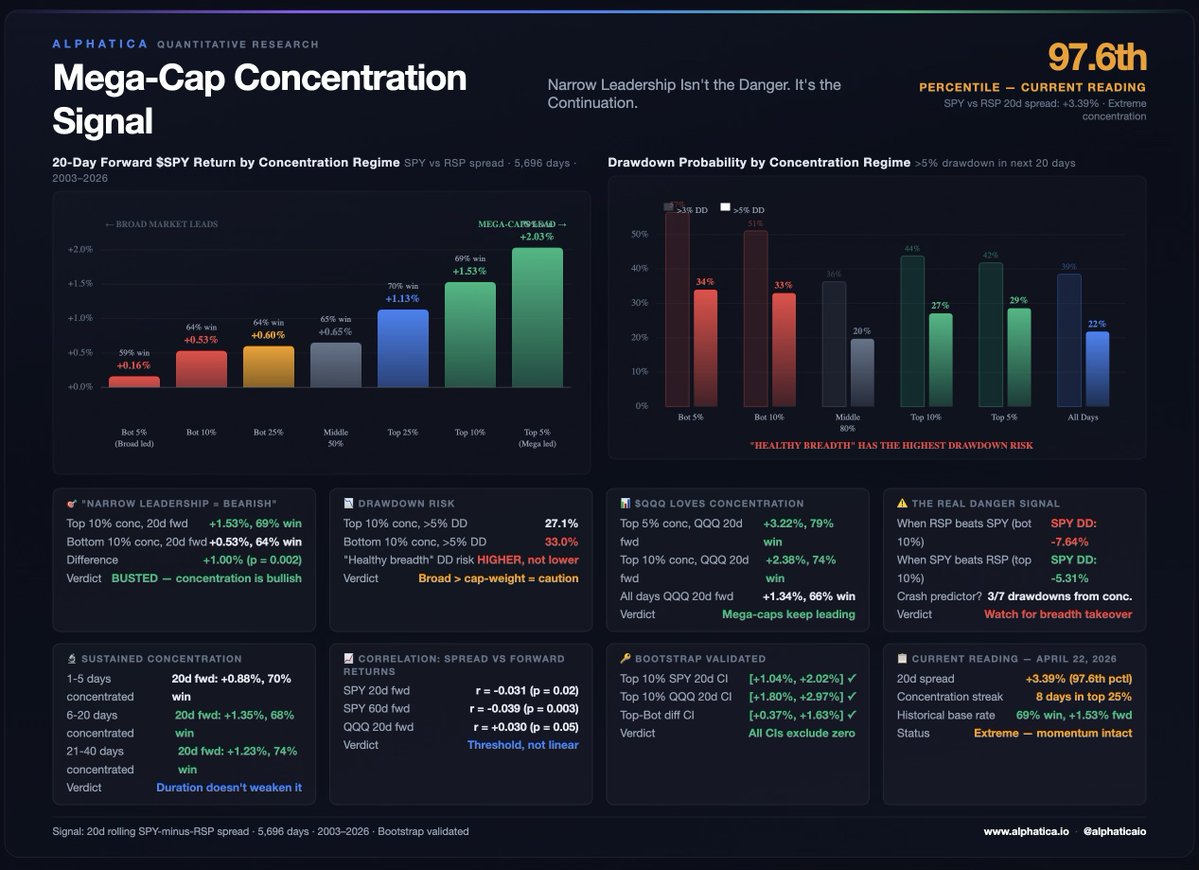
"Only 7 stocks are carrying the market. That's unhealthy. We're due for a correction."
Half of FinTwit has posted some version of this in the last two weeks.
22 years. 5,696 trading days. $SPY vs $RSP (equal-weight S&P 500). We measured the 20-day rolling spread between cap-weighted and equal-weighted returns, the concentration signal. When SPY outperforms RSP, mega-caps are leading. When RSP outperforms SPY, the broad market is leading.
When mega-caps lead (top 10% concentration), $SPY 20-day forward returns are +1.53% with a 69% win rate. When the broad market leads (bottom 10%), it's +0.53% with a 64% win rate. The difference is +1.00% with a p-value of 0.002. Bootstrap confidence interval excludes zero.
Narrow leadership isn't bearish. It's nearly triple the forward return of "healthy breadth."
$QQQ loves concentration even more. Top 5% concentration, QQQ 20-day forward: +3.22%, 79% win rate. When mega-caps lead, they keep leading.
The drawdown data flips the narrative entirely. Probability of a >5% drawdown in the next 20 days when mega-caps lead (top 10%): 27%. When the broad market leads (bottom 10%): 33%. The "healthy breadth" regime has HIGHER drawdown risk. When equal-weight starts beating cap-weight, it often means mega-caps are rolling over and they drag the index down next.
Sustained concentration doesn't weaken the signal. After 21-40 consecutive days of mega-cap leadership, 20-day forward returns are +1.23% with a 74% win rate. Duration makes it stronger, not weaker.
Is concentration a crash predictor? Only 3 of 7 major drawdowns (>10%) since 2003 started from a concentrated reading. The other 4 started from normal or broad-led regimes. Concentration alone doesn't predict crashes. What predicts trouble is when concentration BREAKS meaning when mega-caps stop leading and the spread rolls over.
Current reading: the SPY vs RSP 20-day spread is +3.39%, the 97.6th percentile. This is extreme concentration. FinTwit is calling it a warning sign. The data says it's the strongest forward return regime in the dataset.
The actionable framework:
When SPY is outperforming RSP (concentration rising): stay long, favor $QQQ and mega-cap exposure. The momentum is self-reinforcing. 69% win rate at 20 days.
When the spread is above the 90th percentile: lean into it. The top 10% regime has the best forward returns and the lowest short-term drawdown risk in the dataset.
The warning sign to watch for: when the spread REVERSES meaning when RSP starts outperforming SPY after a period of extreme concentration. That's when mega-cap leadership breaks, and historically that transition carries the highest drawdown risk. We'll flag it when it happens.
The danger signal isn't narrow leadership. It's when narrow leadership stops.
$SPY $QQQ $RSP $NVDA $MSFT $AAPL $GOOGL $META $AMZN
I'm going to be brutally honest here
I pay almost no attention to news headlines
they almost never feature in my market analysis-
and if they DO, my outcomes are almost always worse
(short thread)
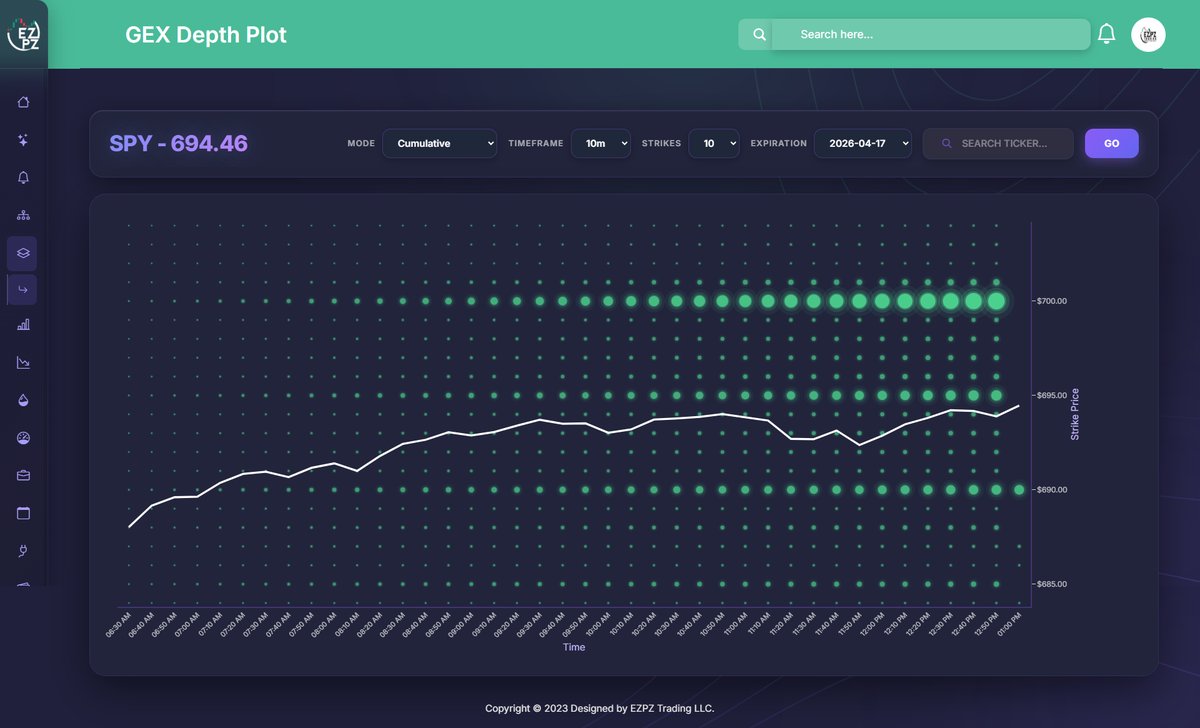
This is how you read the market makers’ hand. 😍
Does that mean #SPX $7000 and $SPY $700 by Friday? No. But the magnetic pull, with no significant negative GEX below those levels, clearly suggests a gamma push is more likely. More importantly the GEX levels formed intraday! (the gradual increase in size)
That said, time and again we have seen an invisible hand distort options data or those levels act as call wall. So I never trade with conviction. I follow the market regime.
If the market regime is 15-20%+ bullish, then I go long big knowing the gamma presure will intensify. If the market regime is bearish, I trade bearish but smaller and more cautiously, with tight stop losses. That’s it.
Learn to time the market’s breath and follow the rhythm... dance with it. If you are tense, you are not riding it, you are drowning. #VIX
Checkout the GEX Depth plot:
https://t.co/7tGxZehNAA