Itô calculus extends traditional calculus to handle stochastic processes with randomness, especially Brownian motion. It defines tools like Itô integrals and Itô’s lemma to analyze systems evolving with noise. In probability and statistics, it underpins stochastic differential equations and models of random dynamics. In ML, it appears in stochastic optimization and diffusion models. In real life, Itô calculus powers financial pricing, weather modeling, robotics control, and biological growth analysis.
Image: https://t.co/I9uySfOtXT
Functional clustering is an unsupervised machine learning technique that groups curves or functions, rather than single data points, based on their shape. It's used to find patterns in "functional data," where each observation is a continuous function. In real life, it's vital for bioinformatics to cluster gene expression profiles over time, in finance to group similar stock price trajectories, and in meteorology to identify common weather patterns. It helps uncover underlying structures in complex time-series or high-frequency data.
Image: https://t.co/OTXrrKpqhl
The German tank problem is a classic statistics puzzle about estimating the maximum of a set (like total tanks, N) from a small sample (captured serial numbers). Its real-life use, famously from WWII, was to accurately estimate German tank production. Today, this logic is used to estimate the total number of taxis in a city or iPhones sold from a small sample of serial numbers. In machine learning, it's a foundational example of Bayesian inference and Maximum Likelihood Estimation (MLE), teaching how to build models that can infer a hidden parameter (the total number) from limited, noisy data.
Image: https://t.co/ItGNXmTOXq
Gibbs sampling is an MCMC algorithm for sampling from complex distributions. In machine learning, it's a key engine for Bayesian inference, notably in Latent Dirichlet Allocation (LDA) for topic modeling. This is used in real life to discover hidden themes in customer reviews or scientific papers. It's also applied in computer vision for image restoration and in statistical physics.
Image source: https://t.co/LBtuGCdOAk
While at Guinness, William Sealy Gosset developed a statistical method to infer population means from small samples, minimizing lab work and cost.
Since Guinness forbade staff from publishing research, he signed his paper "Student".
That's how the Student’s t-test, one of the most important tools in statistics, was born.
How Statisticians Got Prediction Wrong
For most of the 20th century, statisticians built prediction methods on the wrong foundation.
Back in the 1930s and 40s, giants like Jerzy Neyman and Harold Hotelling introduced the idea of prediction regions. The problem they posed sounded reasonable: if the next data point is random, build a set that will contain it with high probability.
And so prediction regions were born. In multivariate problems, they took the shape of neat ellipsoids or circles — the smallest blobs in space that could capture 90% or 95% of all future samples. Mathematically elegant. Geometrically beautiful.
But practically… misguided.
The blind spot
The “blob” view of prediction treats every variable as equally mysterious. It asks: what set in the full space will contain the next random vector?
The problem is that in almost every real-world task, we don’t need to predict the whole vector. We already observe the inputs. What we care about is predicting the outcome.
Think of regression: you already know the covariates X. The question is: what values of Y are plausible, given this X?
Classical joint prediction regions had nothing to say about this. They optimized the wrong criterion.
The cracks show
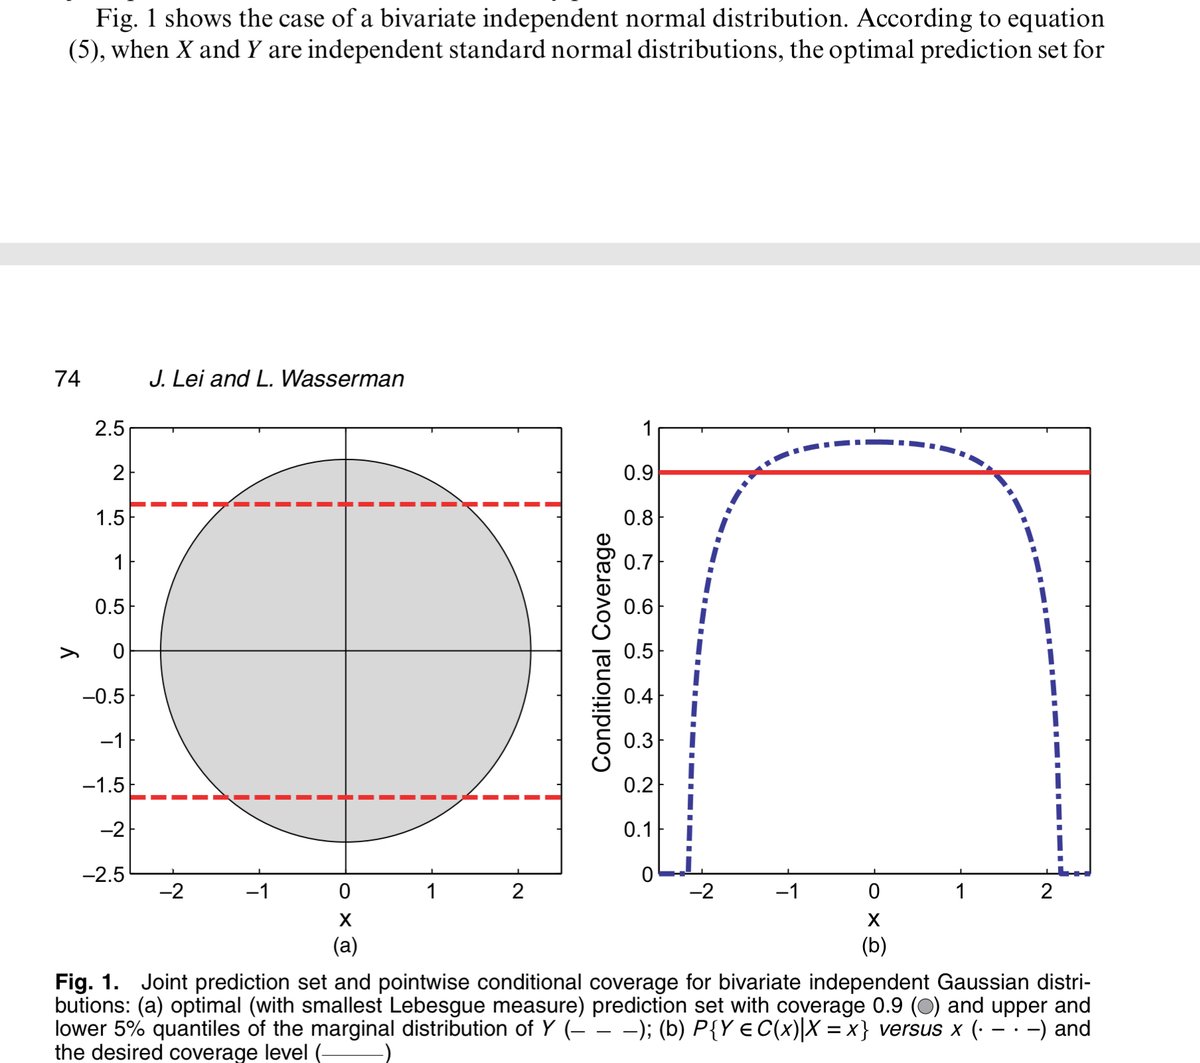
Consider a simple example. If you follow the classical recipe, the “optimal” 90% prediction region for a pair (X,Y) looks like a disc centered at the origin. Lovely geometry.
But slice that disc at a fixed X. and you see the problem: sometimes the vertical slice covers Y with more than 90% probability, sometimes much less. In other words, the coverage depends on where you are.
The method guarantees accuracy on average across all X. But if you actually condition on the X you’ve observed, the guarantee falls apart.
The shift to conditional thinking
It took a long time for this mistake to be widely recognized. Once regression became central, statisticians saw the issue: prediction is about conditional coverage.
We don’t want to be right on average. We want to be right for the data point in front of us.
This shift in perspective led to the development of prediction intervals for regression and, more recently, conformal prediction methods for conditional validity no matter what the data distribution looks like.
The lesson
For decades, statisticians optimized for the wrong goal: the smallest blob in joint space. They solved a problem that was elegant but irrelevant.
The right goal is not to cover the whole future observation. It’s to cover the part we actually care about — the outcome — given what we already know.
That’s the difference between yesterday’s “prediction ellipsoids” and today’s conditional prediction intervals.
S.N. Bose revolutionized statistical physics with his work on quantum statistics for indistinguishable particles. He derived Planck's blackbody radiation law without classical assumptions, treating photons as indistinguishable. This led to Bose-Einstein statistics, which describes particles now known as bosons. His collaboration with Einstein extended this to massive particles, predicting Bose-Einstein Condensation, a new state of matter. His groundbreaking insights laid the foundation for understanding bosonic systems, impacting fields from condensed matter to quantum field theory.
Information Theory, formalised by Claude Shannon in the 1940s, is one of the planks of 20th & 21st century science. You can now watch all 8 lectures we're showing from Sam Cohen's popular 3rd year @OxUniMaths course.
Unless that's too much information.
https://t.co/27LPOo11vo
The Kalman Filter was once a core topic in EECS curricula. Given its relevance to ML, RL, Ctrl/Robotics, I'm surprised that most researchers don't know much about it - and up rediscovering it. Kalman Filter seems messy & complicated, but the intuition behind it is invaluable
1/4
Here are the first five sets of slides:
01 Introduction: https://t.co/PIiBqLRIDB
02 Classical 2x2 setup: https://t.co/SH7w5h7MTk
03 Clustering issues: https://t.co/2v72H48HhW
04 Functional form: https://t.co/1qld58HTMI
05 Covariates: https://t.co/4MsX2n6j7w
Upgrade your #causalinference arsenal.
A revision of our book "Causal Inference: What If" is available at https://t.co/3rrh0l8nFu
Thanks to everyone who suggested improvements, reported typos, and proposed new citations and material.
Enjoy the #WhatIfBook. Also, it's free.
I'm releasing an entire university-level Probability course in the thread below. 100% FREE
I'll be adding one video per day, everyday until everything essential topic in probability is covered.
New content will be posted everyday for at least the next 3-4 months.
Follow along if you want to learn.
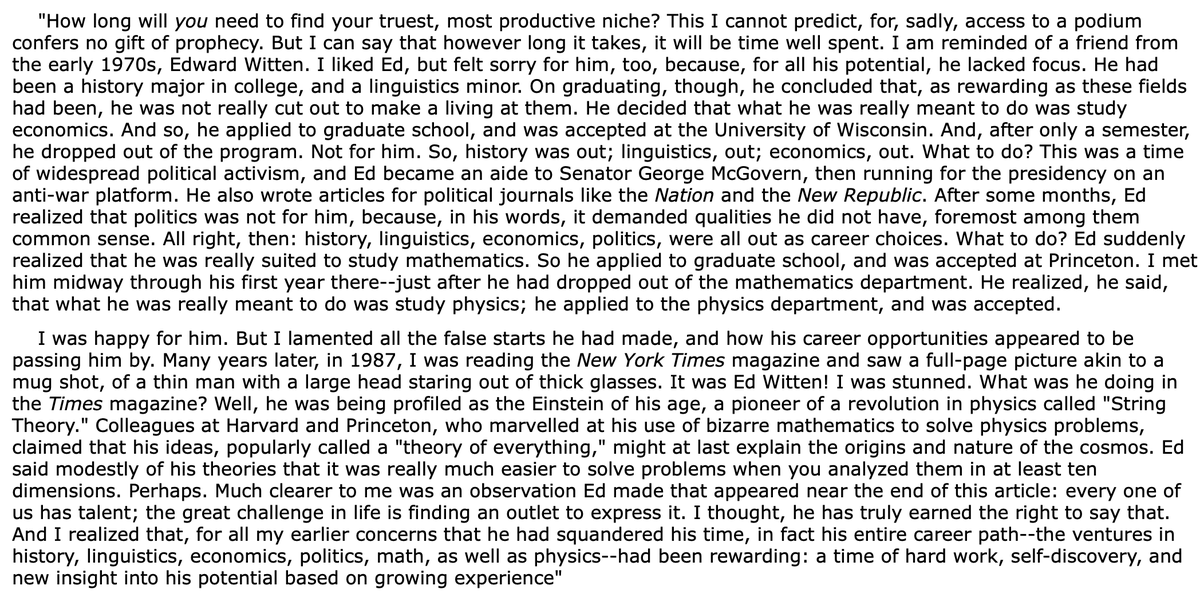
This recollection of Ed Witten's early career by a friend from his college days is really something. It shows that even geniuses can meander and flounder quite a bit before making a mark.
Mastodon has just passed over 2 million active monthly users, a new record! People are voting with their feet. The future of social media doesn't have to belong to a billionaire, it can be in the hands of its users.
Observational Studies is excited to announce our new special issue "Rebels with a Cause: Monologues from Heckman, Pearl, Robins, and Rubin": https://t.co/W1uipH5VKr
These fascinating monologues are followed by insightful perspectives by Didelez, Mealli, and Tchetgen Tchetgen
Free textbook: Intro to Probability for Data Science
https://t.co/imyXY47ePH
Live recording of my lecture ECE 302, Fall 2022
Lecture 1: Series and Approximation.
https://t.co/9DRAuYiSMn
#DataScience#MachineLearning#Statistics