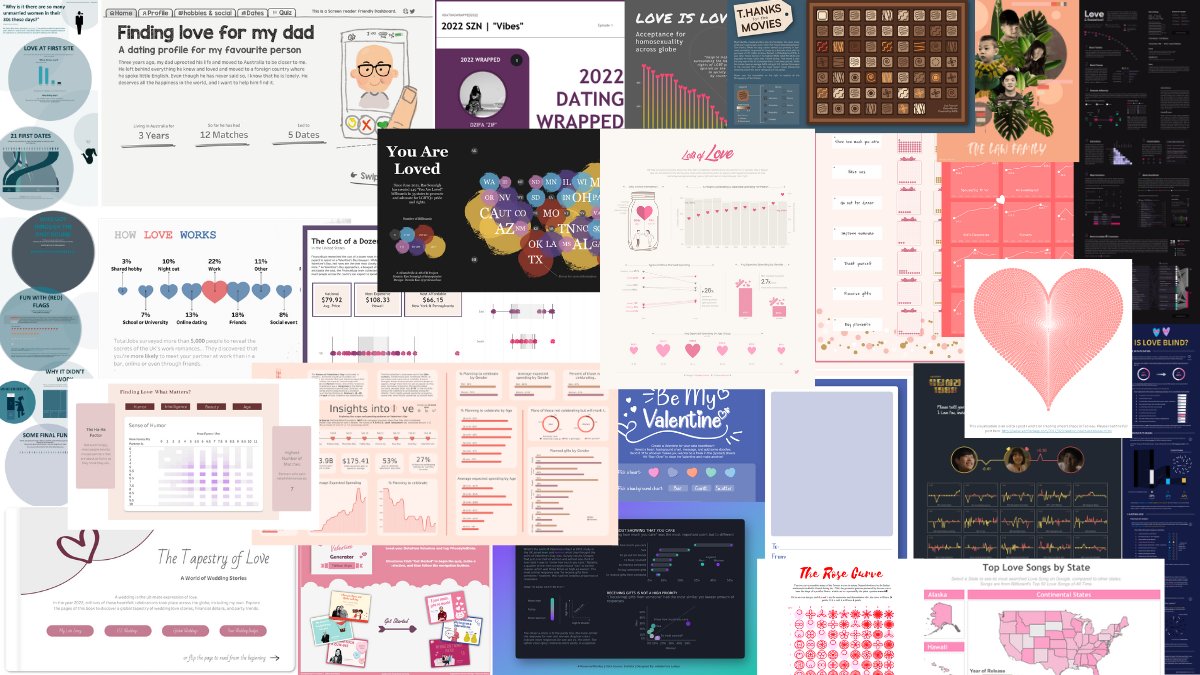
Fall in love with data. ❤️
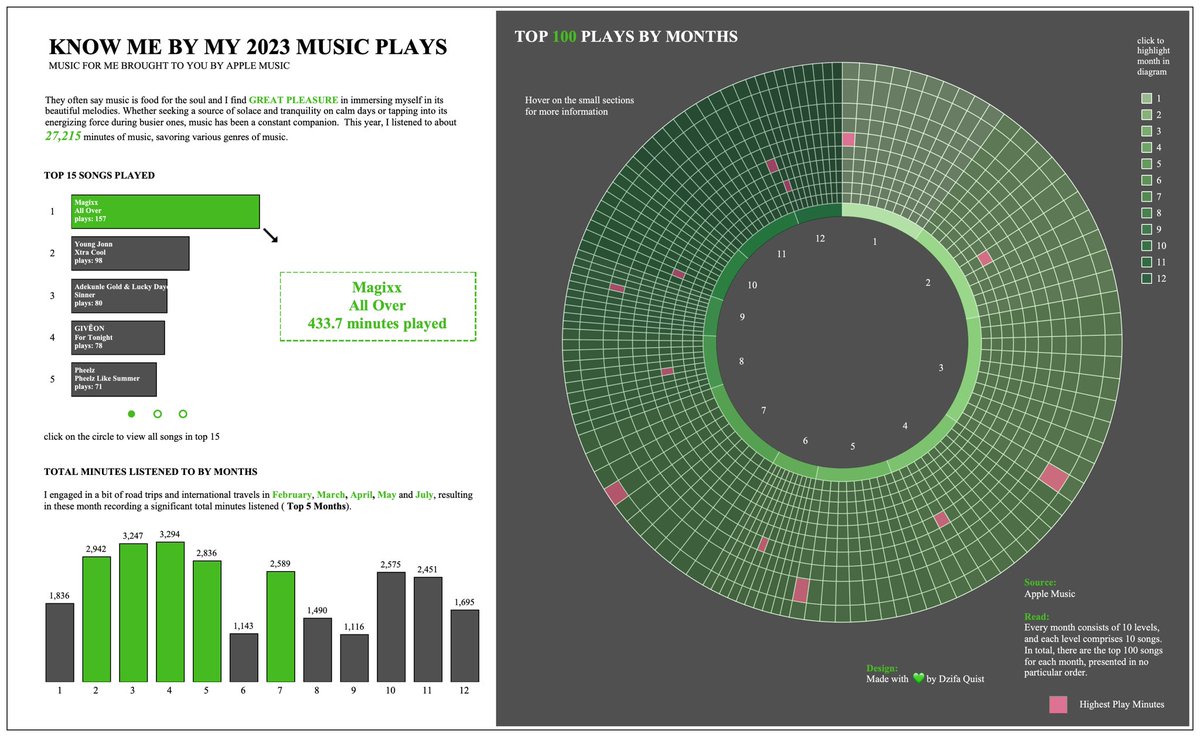
Dive into Tableau Ambassador @datadzif's curated list of #DataFam visualizations celebrating Valentine's Day. https://t.co/fepBVbvs3C
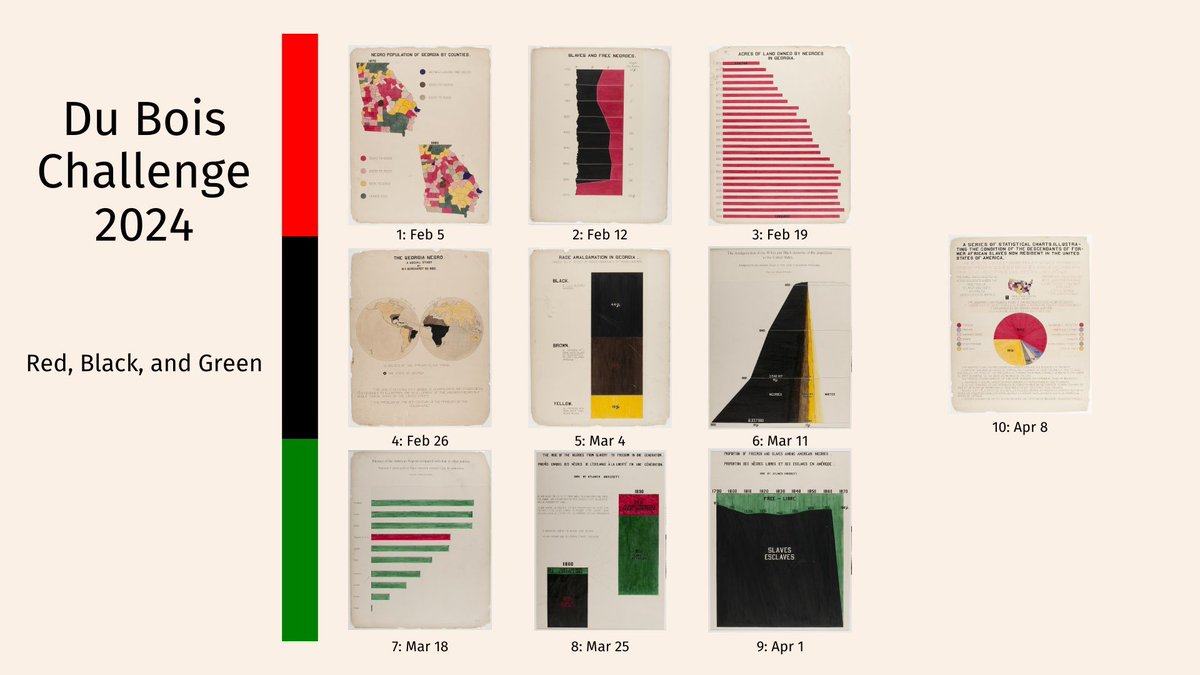
Advance your #dataviz skills by joining the weekly #DuBoisChallenge2024. Starting on Feb 5th, re-create visualizations from the 1900 Paris Exposition using modern tools. More details: https://t.co/1VnZMEQYWD.
🎁 Win prizes by sharing your work in the DVS Slack.
Drop the mic! 🎤
Tableau has been named the #1 Analytics Product in the @G2dotcom 2024 Best Software Awards.
A massive thank you to our customers and community for the recognition.
https://t.co/O5uwBYjYgs
Looking to grow your data skills?
Check out @TableauPublic—a free platform that allows you to explore, create, and share data visualizations online.
Plus, a great resource to bookmark if you’re entering the #DataPlusMovies challenge! https://t.co/2hE2kYl49N
Movies are like a box of chocolates. You never know what you're gonna get.
🔗https://t.co/MpIMGqasQJ
I had some fun visualizing @tomhanks movies as a box of chocolates for the #DataPlusMovies challenge. THanks so much for the data @tableau and @IMDb!
It's been a while since my last viz on @tableaupublic. Here's a look at the Gender Inequality Index across 170 countries reflecting gender-based disadvantage in multiple dimensions.
Thanks to @ladataviz for the easy to use beeswarm generator.
🔗https://t.co/31DTcCTEyc
Explore this #VizOfTheDay by @GeorgeKoursaros featuring a map of the Greek lighthouses and beacons across the thousands of islands and islets. https://t.co/jaiKhGBtdH
Business dashboards don't have to be boring. Get inspired by this #VizOfTheDay from the vault by @ellenblackburnn which visualizes wealth and banking data. https://t.co/VlbcmiIH2V