markov chains are simple but powerful.
they model systems where the next state depends on the current state.
not the whole past.
• states → possible conditions
• transitions → ways the system moves
• probabilities → uncertainty with structure
• memorylessness → only now matters
• steady state → long term behavior emerges
weather.
markets.
language.
biology.
robot navigation.
queues.
markov chains teach you a brutal systems lesson:
complex behavior can emerge from simple transition rules.
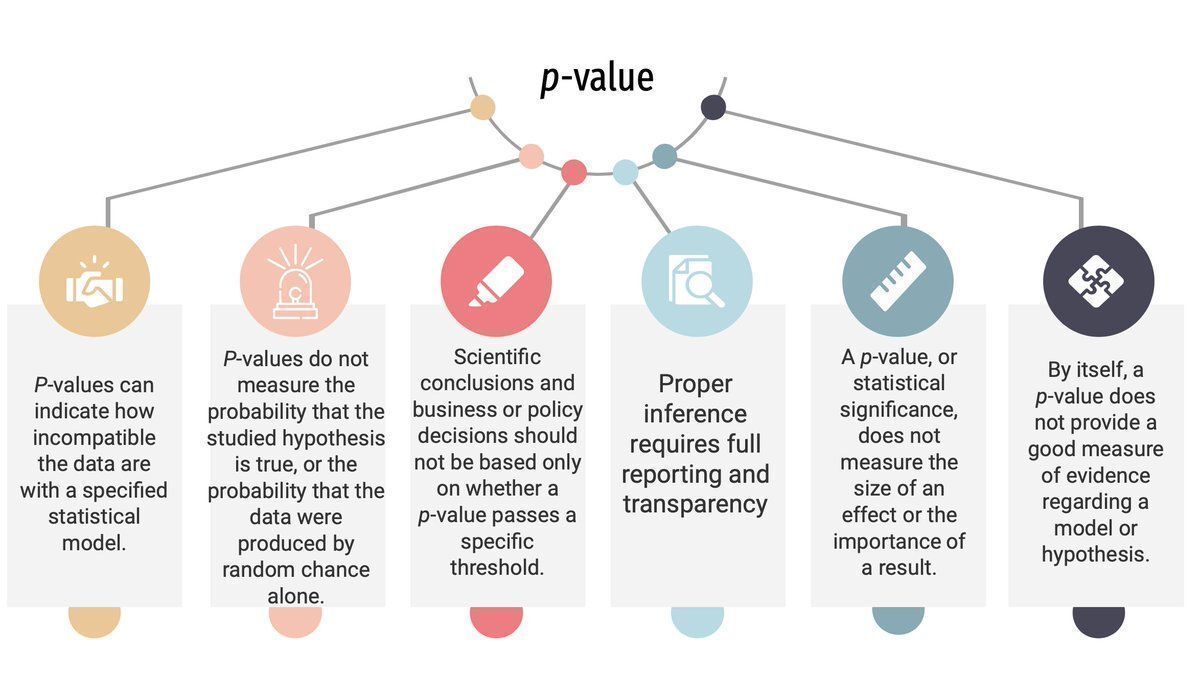
🚨 ¿Qué es realmente el p-valor y por qué debería importarte?
El p-valor es un sistema de alarma, una "línea de defensa" contra el ruido.
👉 Úsalo para calibrar cuánto te sorprende lo que estás viendo y qué tan dispuesto estás de cambiar tus creencias.
#stats#datascience
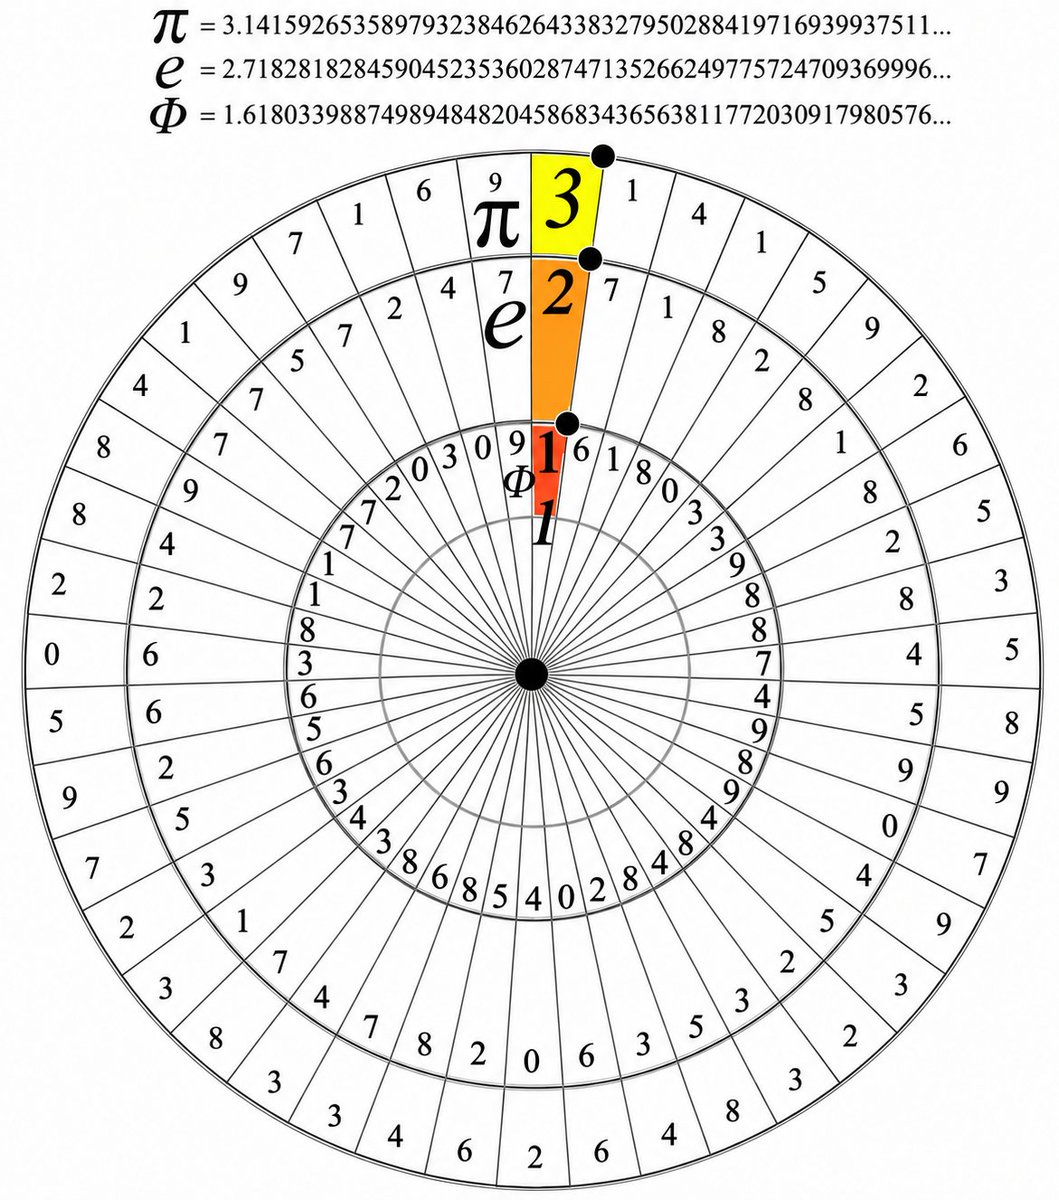
Hidden in plain sight, the opening digits of π, e, and Φ take center stage in a circular visualization of their expansions.
π starts at 3, e at 2, and Φ at 1. Their decimal expansions appear at the top. Concentric rings display sequences of digits 0-9 to illustrate their unending decimals.
It is used to calculate circle properties in engineering and physics with π, exponential functions in science and finance with e, and balanced designs in art and architecture with Φ.
the math that make robots move.
• linear algebra → vectors, matrices, rotations, transforms
• trigonometry → angles, joints, wheels, motion
• calculus → velocity, acceleration, change
• differential equations → dynamics over time
• probability → sensors, uncertainty, localization
• optimization → planning, control, learning
robotics is not just code.
it is geometry + motion + uncertainty + control.
learn the math or you’ll keep guessing why the robot behaves like a drunk insect.
A good scientist is a person with original ideas. A good engineer is a person who makes a design that works with as few original ideas as possible. There are no prima donnas in engineering."
- Freeman Dyson
Unlock the language of algebra with these core symbols.
From equal by definition and function composition to discriminants, inner products, and matrix inverses; everything you need for equations, proofs, and higher math in one clear layout.
These symbols are used daily by engineers designing circuits, data scientists building machine learning models, and physicists describing motion and forces.
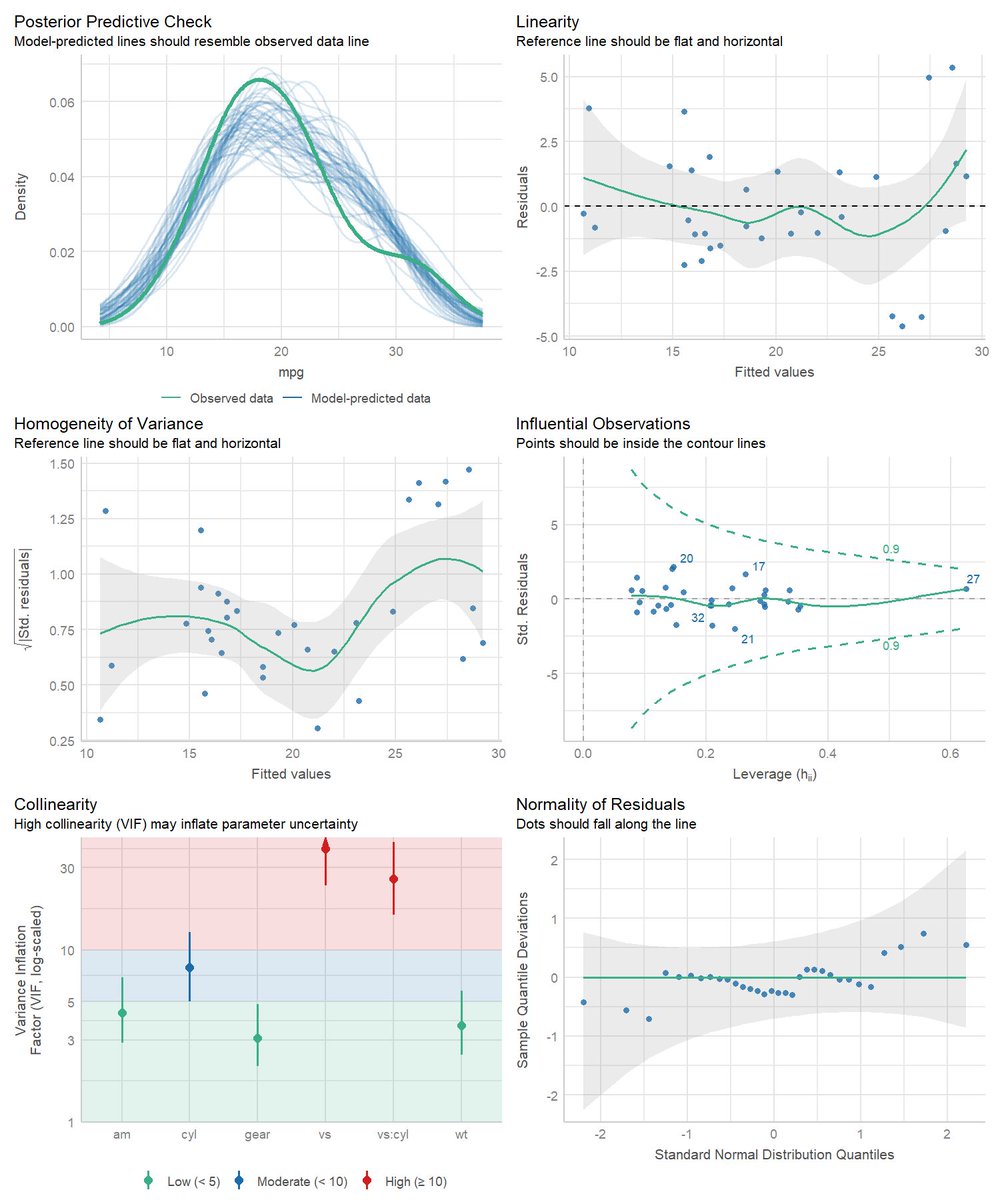
📊 Un modelo "funciona" si sobrevive al diagnóstico
En R, {performance} te permite revisar:
- colinealidad → check_collinearity()
- normalidad de residuos → check_normality()
- heterocedasticidad → check_heteroscedasticity()
- diagnóstico global → check_model()
#rstats#stats
FREE Math book. 700 pages.
"Everything You Always Wanted To Know About Mathematics: A Guided Journey into the World of Abstract Mathematics...", by Sullivan, with Mackey. Polynomnomnomials, Gauss in the House, The Full Monty Hall, Dominoes and Tilings, The Tower of Hanoi, Combinatorics, Pigeonhole Principle, Jections, Cardinality, Proofs, Set Operations, etc.
Link: Instructor John Mackey at CMU, Welcome Page, https://t.co/4om1T8wpdT
The shaded area under a curve grows at a rate exactly matching the curve's height at that point.
Fundamental Theorem of Calculus proves that the derivative of A(x) = ∫_a^x f(t) dt is f(x). It uses the limit definition of the derivative and the mean value theorem to show that the added area over [x, x+h] divided by h approaches f(x) as h approaches 0 under continuity.
d/dx ∫_a^x f(t) dt = f(x)
The theorem let us move between totals and their rates, such as velocity from position in physics or marginal cost from total cost in economics.
Instead of watching an hour of Netflix, watch this 2 hour hour Stanford lecture will teach you more about how LLMs like ChatGPT and Claude are built than most people working at top AI companies learn in their entire careers.
You only need to read four books to truly get what’s going on in data science and AI:
• Designing Machine Learning Systems by Chip Huyen
• AI Engineering by Chip Huyen
• Practical Statistics for Data Scientists by Peter Bruce, Andrew Bruce, and Peter Gedeck
• Hands-On Machine Learning with Scikit-Learn, Keras, and TensorFlow by Aurélien Géron
If you read these four technical books and then read these four books on business value and leadership, you’ll be well on your way to career success:
• The Lean Startup
• Good Strategy Bad Strategy
• The First 90 Days
• The Hard Thing About Hard Things
Any more you'd add?
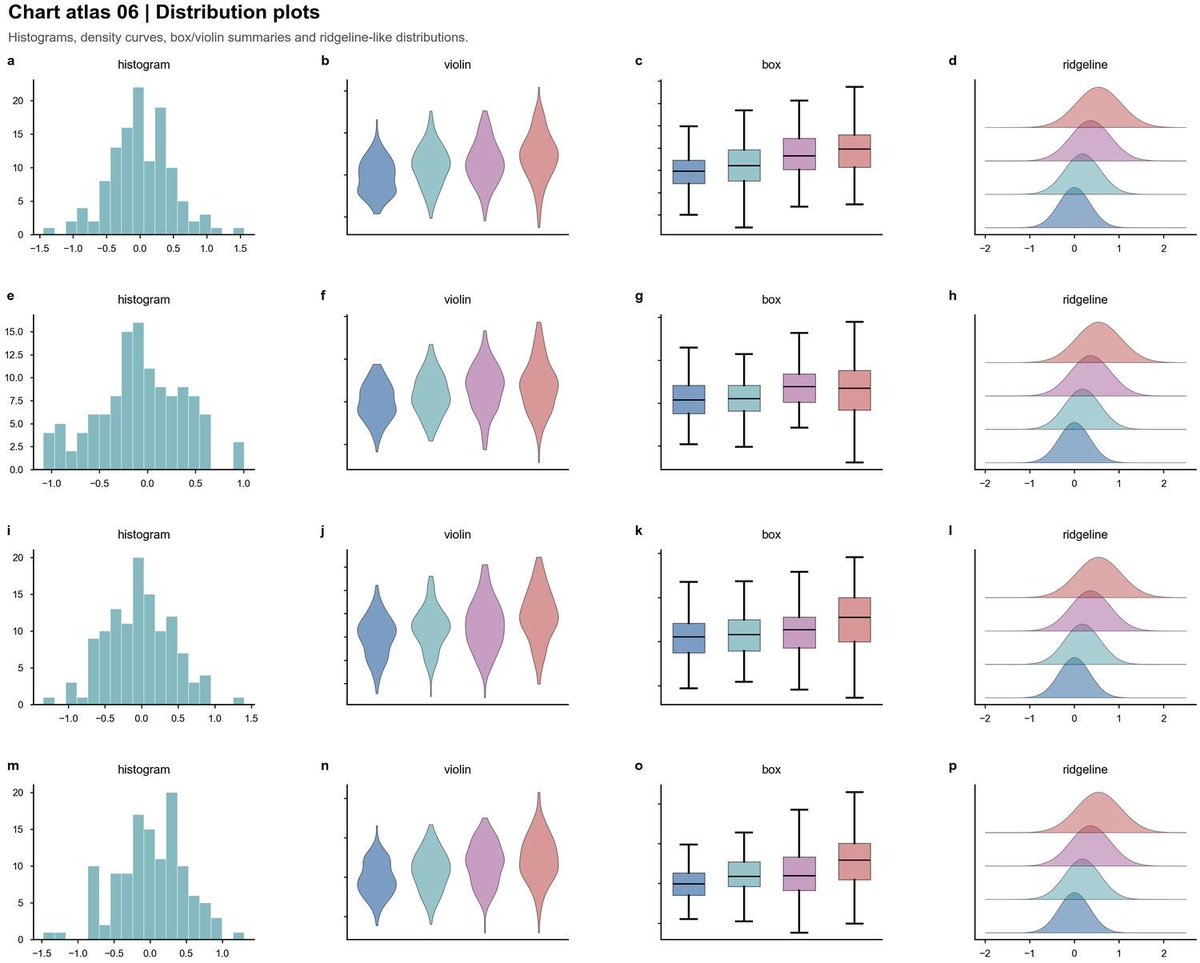
¿Tus gráficos científicos parecen un jeroglífico? 📊
No dejes que una mala figura arruine años de investigación. 📑 Está short en NatureHumBehav explica cómo diseñar figuras que realmente comuniquen. 🚀
1️⃣ Clarifica tu mensaje central 🎯
Antes de abrir el software, define qué debe aprender el lector. Si no está claro para ti, no lo estará para ellos.
2️⃣ Conoce a tu audiencia 👥
Un gráfico para una reunión de laboratorio no es igual que uno para una charla pública. Ajusta el nivel de detalle al contexto.
3️⃣ El tiempo es oro ⏳
Piensa cuánto tiempo tendrá el lector para interpretar la figura: segundos en un póster, más tiempo en un artículo.
4️⃣ Color con intención 🎨🌈
Usa el color para distinguir grupos o magnitudes, no como decoración. La paleta debe servir al mensaje.
5️⃣ Minimiza la carga cognitiva 🧠
Reduce el ruido visual. Si un elemento no apoya el mensaje principal, sobra.
💡Ojo, a veces, una tabla bien estructurada comunica mejor que un gráfico complejo. No fuerces la visualización. @COSCEorg@SEMicrobiologia@ANIH_1 #Ciencia #DataViz #Investigación #ComunicaciónCientífica #Diseño #ScientificWriting #Academia #comunicaciencia #divulgaciencia
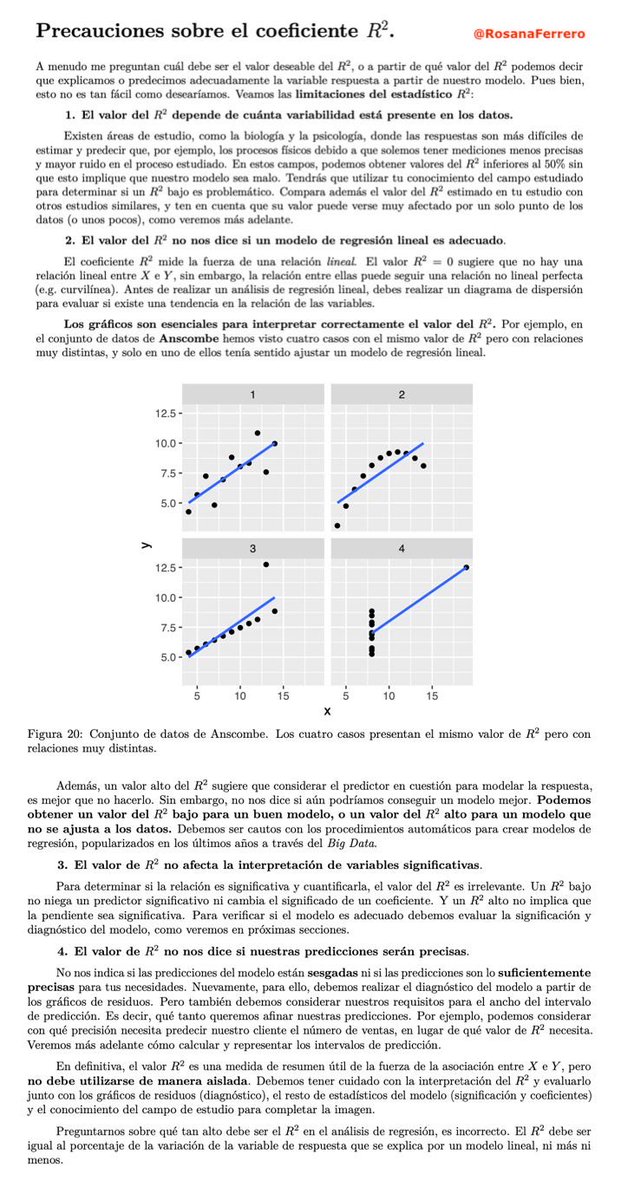
💣 Recordatorio periódico: Cuidado con malinterpretar el R²
La interpretación “porcentaje de variación explicada" solo es cierta bajo condiciones concretas:
- Modelo lineal estimado por OLS
- Inclusión de intercepto
- Evaluación en la misma muestra usada para ajustar el modelo
Evaluar un modelo de regresión es una parte clave del análisis. Un modelo puede parecer “bueno” a simple vista, pero sin una evaluación rigurosa es fácil caer en conclusiones engañosas.
Ahora, para evaluar un modelo necesitas múltiples perspectivas y preguntas distintas👇🧵
Si estas estudiado computación, ingeniería, matemáticas a nivel universitario seguro tuviste que demostrar y no entiendas como hacerlo.
No hay una materia que te enseñe.
Por eso escribí un libro sobre CÓMO DEMOSTRAR.
Enlace al E-book → https://t.co/JE0e5dGhIt
En este libro enseño TODOS los métodos de demostración que necesitarás en toda la carrera.
Incluyo, además, cómo funcionan y todos los fundamentos a nivel lógico.
Gratis y de aceso libre.
Nada te hará entender mejor la matemática que saber demostrar.


![mathemetica's tweet photo. The shaded area under a curve grows at a rate exactly matching the curve's height at that point.
Fundamental Theorem of Calculus proves that the derivative of A(x) = ∫_a^x f(t) dt is f(x). It uses the limit definition of the derivative and the mean value theorem to show that the added area over [x, x+h] divided by h approaches f(x) as h approaches 0 under continuity.
d/dx ∫_a^x f(t) dt = f(x)
The theorem let us move between totals and their rates, such as velocity from position in physics or marginal cost from total cost in economics.](https://pbs.twimg.com/media/HKi5hspagAAyvtG.jpg)