En equipo por una #agricultura sostenible! El estreno latinoamericano de la #pelicula Common Ground de @rocofilms - 18 de enero, Culiacán 🍿
Info: https://t.co/DPVP1TzxBG
Gracias al Comité Organizador y a los patrocinadores x su apoyo para hacerlo una realidad!
@commongrounddoc
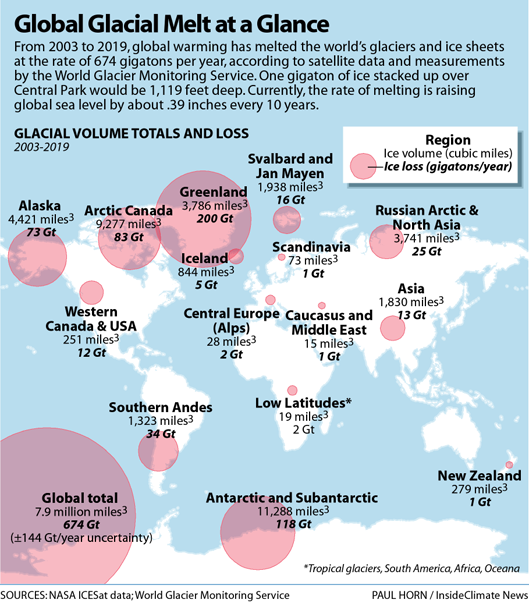
Global glacial melt 🗻 per region
#Ice loss (Gigatons/year) 🧊
674 Global total
Top 5:
200 Greenland
156 Arctic Canada & Alaska
118 Antarctic
34 Southern Andes
25 Russian Arctic & North Asia
#ClimateCrisis#SDG13
(@insideclimate)
#carbonneutral goals
137 countries committed
✅Bhutan & Suriname already carbon negative
2030-2045: Uruguay, Finland, Austria, Iceland, Germany, Sweden
2050: 124 countries
2060: China, Kazakhstan, Ukraine
2050-2100: Australia & Singapore
(@VisualCap)
Drylands 🏜️
3.8 billion people live in climate-vulnerable drylands
25% of the global population
50% of the world’s livestock
27%of the world’s forests (2019)
store 30%of the world’s soil organic carbon
supply ~60% of the world’s food production (2018)
@FAO | @IUCN
#ClimateChange & Displaced people
33.4 million newly displaced (2019)
▪️ 70% due to climate-related disasters 🌀🔆🌪️🌧️
(2008–2018) 23M people/year
▪️ 90% of which have had weather-related triggers 🌊🌬️🔥
#ClimateCrisis@CGIAR | @CGIARclimate | @FAOclimate | @CARE
#eWaste Generated Per Capita
(kg/capita, 2019)
21 North America🌎
16 Europe 🌍
16 Oceania🌏
9 Latin America & Caribbean 🌎
6 Asia🌏
3 Africa 🌍
#CircularEconomy
(@ChathamHouse)
Past Earth #Overshoot Dates
1970: December 29
1980: November 4
1990: October 11
2000: September 23
2010: August 7
2019: July 26
2020: August 22
2021: July 21
(@EndOvershoot)
Mountains & Water
#African#rivers, basins and #topography.
Longest river: Nile
Highest mountain: Mt. Kilimanjaro
(via @Antropocenista & @TopographicMaps)
#InternationalWomensDay
Almost 1/3 women’s employment globally is in agriculture, forestry and fishing (may exclude self-employed & unpaid family workers).
Share in countries
9.5% upper-middle-income
2.6% high-income
over 60% most low-income and lower-middle-income
@UN
Average #foodwaste
(kg/capita/yr) by region
110 West Asia
108 Sub-Saharan Africa
90 South Europe
82 SE Asia
81 Australia & NZ
74 North Europe
69 Latin America
69 North America
66 South Asia
65 West Europe
64 East Asia
61 East Europe
@UNEP | via @theagroindex
#FoodLoss & #FoodWaste ActionWeek
Food loss & waste alone could take the 3rd place 🥉in the country CO₂E emissions chart, with 4.4 GT
➡️1.6 billion tons of #foodwaste produced each year
🥇🇨🇳CHN 10.7 GT
🥈🇺🇸 USA 5.8 GT
(Estimates, 2011/12)
(@WorldResources | @entoprotech)
#InternationalPolarBearDay 🐻❄️
10 facts:
1. Marine mammals
2. Black skin!
3. Speed: 40kmph land-10kmph water
4. Largest land carnivore
5. Smell from 1km & 1m of snow
6. Take snow baths
7. 2% hunt success
8. ~26,000 in the wild
9. live ~30 yr
@ArticKingdom | @PolarBears | @wwf_uk
7 agricultural commodities — cattle, oil palm, soy, cocoa, rubber, coffee and plantation wood fiber — accounted for 26% of global tree cover loss from 2001 to 2015.
(@TraseEarth | @globalforests)