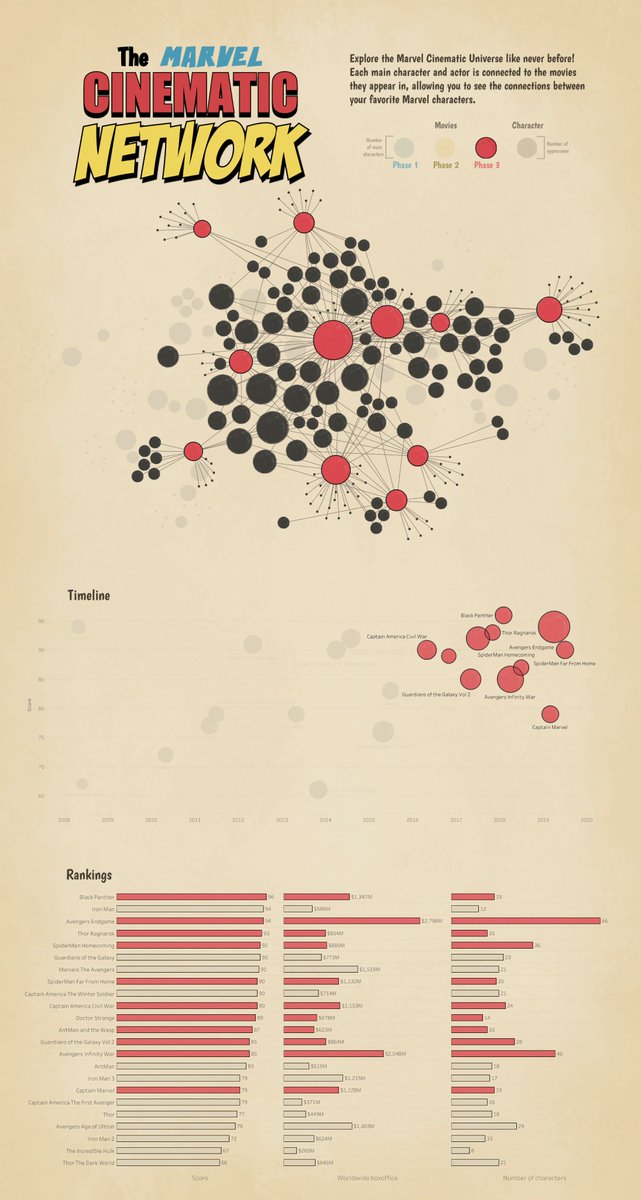
The Marvel Cinematic Network now has a @tableau version!
👉 Interactive Version: https://t.co/XIFeShrhkB
Thanks to the people at #VizIt that came to my session, where we built this together using @tableau, @figma, and @Procreate!
Part of my process below 🧵👇
love this course so much, although working on 5 group projects in one semester is sometimes rly intense and a lil struggling. To the future #geog384 students who happen to browse my tweet by any chance: You will gain far more than you think after the course and never give up!🥰
My 39/39 #neogeoweb tweet, Thank u @re_sieber for designing such a creative way for participation! I have never used Twitter before, but I realized that I could be so immersed in enjoying those fantastic maps on my homepage. Shout out to #geog384 and all #neogeoweb contributors!
In March 2022 Russian info troops set up numerous local news channels across Ukraine gambling they stand a better chance of winning public trust.
But instead of breeding a media monster they ended up with a paper tiger. Our new #ddj project explains why.
https://t.co/Pe3UM6QU4W
#neogeoweb couldn't agree more with the opinion in the article: "What makes a graphic good isn't whether it tries to approximate an ideal of truth, beauty, goodness, or excellence;rather, it's whether actual people can make sense of it, learn from it, or enjoy it."thx for sharing
#neogeoweb haven't thought about it before, but rly interesting that I recall most of the maps I saw or retweeted recently remove the north arrow
https://t.co/7q72Qami1s
#30DayMapChallenge 3D - I had to make something for this day! The second chapter in my 'Scenic Bus Journey' series looks at the charming route of the Lakes Connection 555 from Lancaster to Keswick. Complete with sailboats and paragliders of course 😅 #3d#map#animation
I'm excited to announce pygris, a new #Python package to help you work with @uscensusbureau geographic datasets (and other resources)!
Read the docs: https://t.co/B88QY8ZgM4
Try out pygris on Colab: https://t.co/q598QCA0eZ
Source code: https://t.co/PuBfQGEeMF
#pydata#gischat
Everything connected to the internet takes bandwidth to view 📲
When you look at something on your smartphone, your device is downloading the data in the background.
In this chart, we break down The World’s Most Used Apps, by Downstream Traffic in 2021:
https://t.co/ejE3TZgcVq
#neogeoweb rly enjoy reading the article and author's perspective: If we stop using our eyes, we start to live in our phones, live in our maps, and find out eventually that we are unhappy with a life devoid of spontaneity.
https://t.co/uB0T8kvF1i
1.41 a.m.: 78 sheep in my mind in sheep terrain format. To human terrain creators @puddingviz what a fantastic visualization job you did to impress me in such a way!
#neogeoweb learning geovisualization be like:
BEFORE: count sheep to fall asleep
AFTER: count sheep and… I can display sheep I count in sheep terrain, maybe one large sheep stands for 100 and track my sleep pattern, wait what types of sheep did I count.. damn I am so AWAKE rn
#neogeoweb check out this human terrain - Visualizing the world's Population in 3D. I thought the map was missing Canada statistics at the first glance then realized it actually did haha
https://t.co/U8RhY7jzTL
#neogeoweb An interesting visualisation of public transit transform in different cities together with the change of urban morphology
https://t.co/iB0jNhV01P
Egypt is moving its capital for the 26th time. By moving the center of government, leaders send a clear message to their subjects and the world: They're in charge, and Egypt is theirs to shape. Read story in the Nov issue of @NatGeo https://t.co/JLVPz5pBgq
#Egypt#Cairo