1,000 days in space! 🌌📷
As of today, our Psyche spacecraft has been traveling for a thousand days. Watch for more views of its recent Mars flyby soon! Next stop: the intriguing, metal-rich asteroid 16 Psyche.
Forecast models increasingly agree that #ElNiño is the most likely outcome for the second half of 2026.
You can observe El Niño in real-time using the El Niño Southern Oscillation dashboard, which allows monitoring of El Niño and La Niña events through the visualisation of sea surface temperature anomalies across the standard El Niño monitoring regions.
Read the latest Ocean Health Bulletin to learn more about #ElNiño and how to watch it develop in real time with #CopernicusMarine: https://t.co/W3MTTxlUaa
AI is helping us better understand how landslides occur – so that we can reduce risks.
Researchers at @RITtigers used landslide aerial views, elevation data andmachine learning to accurately identify landslide movements.
Learn more ➡️ https://t.co/iNLEZ0joJ2
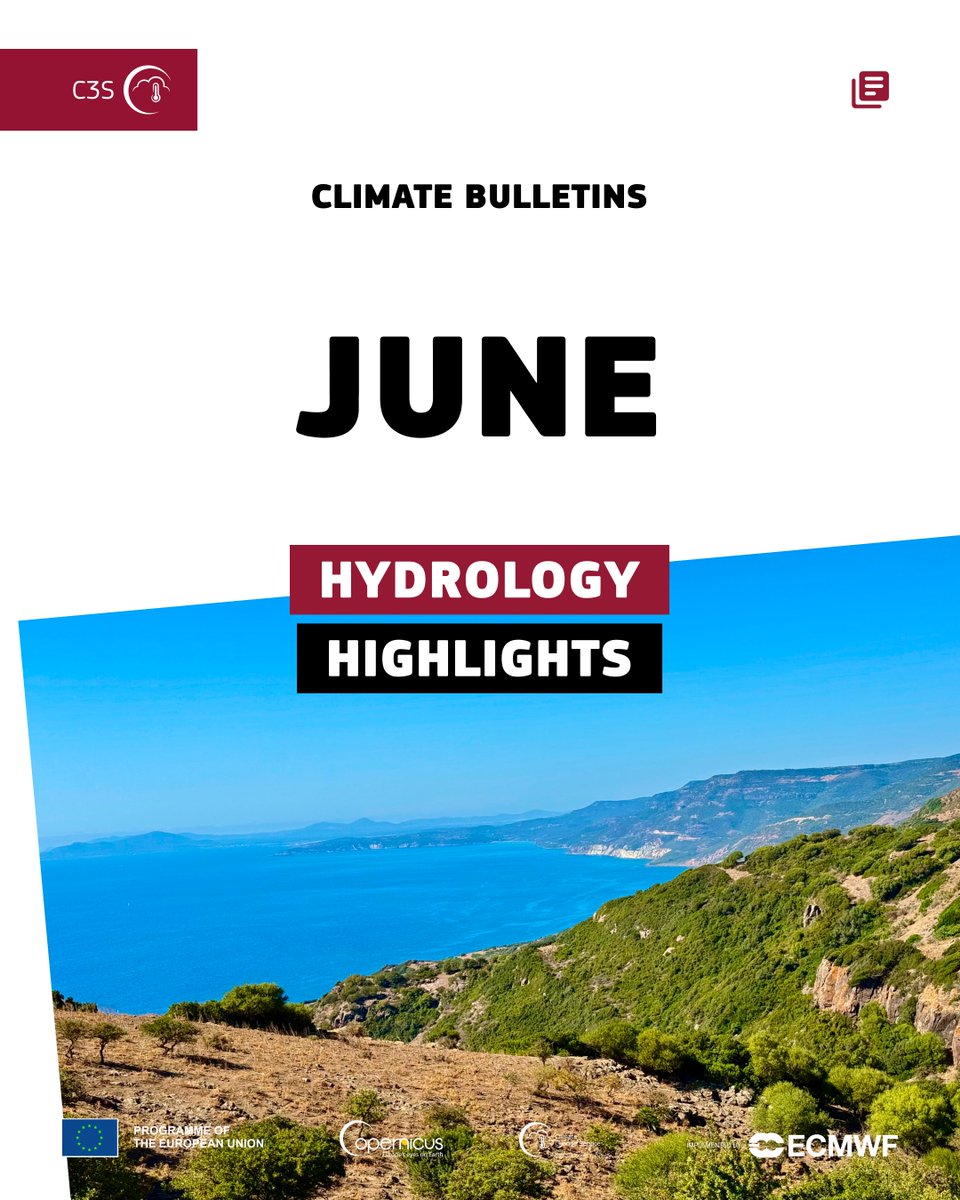
💧 The #C3S Climate Bulletin reports drier‑than‑average conditions in June across much of western & central Europe and parts of eastern Europe, while Iceland & Ireland were wetter than average. River flow was below average across central, eastern & north‑eastern Europe.
⬇️
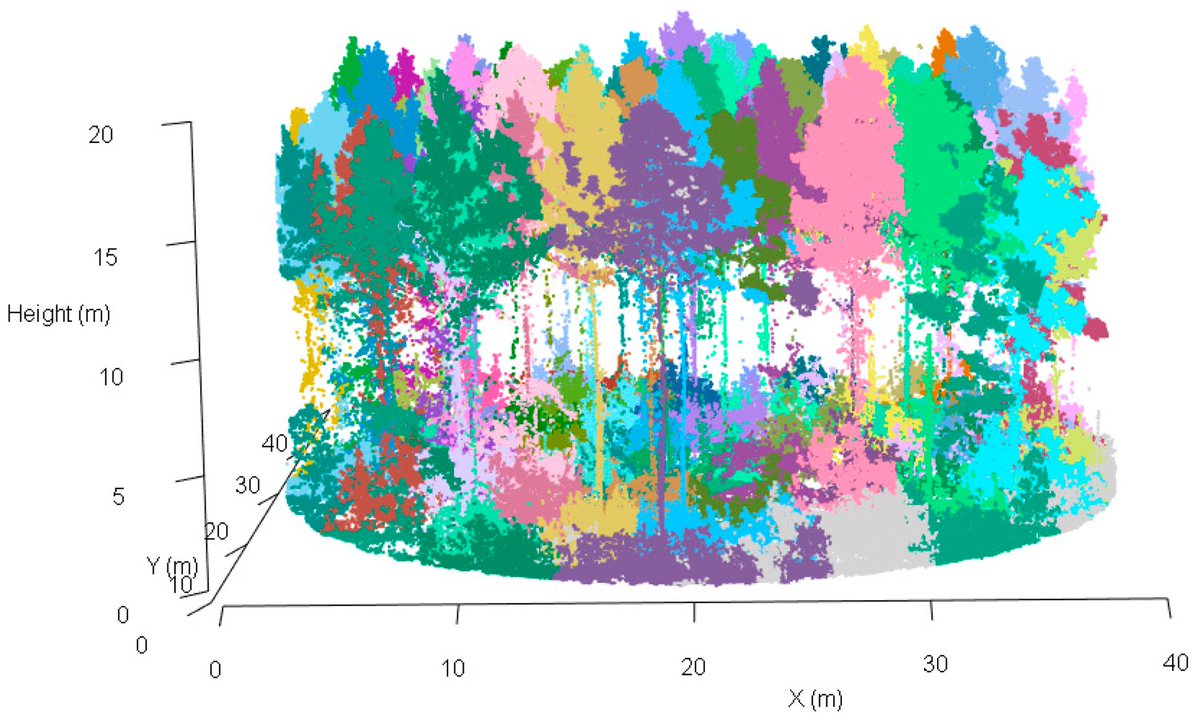
🌳🌳 Assessing Methods to Measure #Stem#Diameter at Breast Height with High Pulse Density Helicopter #Laser#Scanning
✍️ Matthew J. Sumnall et al.
🔗 https://t.co/MunIRL5cWw
The Earth's energy is out of balance. Our planet absorbs more energy from the Sun than it releases into space and it's getting worse. This excess energy fuels stronger storms, droughts and floods.
No single satellite can measure this tiny signal. ESA’s Climate Change Initiative combines satellite observations across land, ocean, ice and atmosphere to estimate Earth’s energy imbalance and surface air temperature, helping modellers improve forecasts.
Check out our new data story: https://t.co/tNmTlQvInv
💧💧 Characterizing #Tidal#Marsh Inundation with Synthetic Aperture #Radar, #Radiometric Modeling, and In Situ #Water Level Observations
✍️ Brian T. Lamb et al.
🔗 https://t.co/ahlRneMhoZ
June 2026 is Western Europe’s warmest June on record and the 2nd-warmest June globally, according to @CopernicusEU Climate Change Service's latest bulletin. The global average surface air temperature was 16.54°C—1.39°C above pre-industrial levels.
🔗 https://t.co/E25oWMkSse
REDES 2.0: A pan-European rainfall ⛈️🌧️erosivity dataset showing intensifying erosivity trends in EU🇪🇺. REDES 2.0 expands rainfall data to 9138 stations🚉 across Europe compared to 1541 stations of REDES 1.0. Important for soil conservation🚜, farming👨🌾.
https://t.co/gwO4r1zTFp
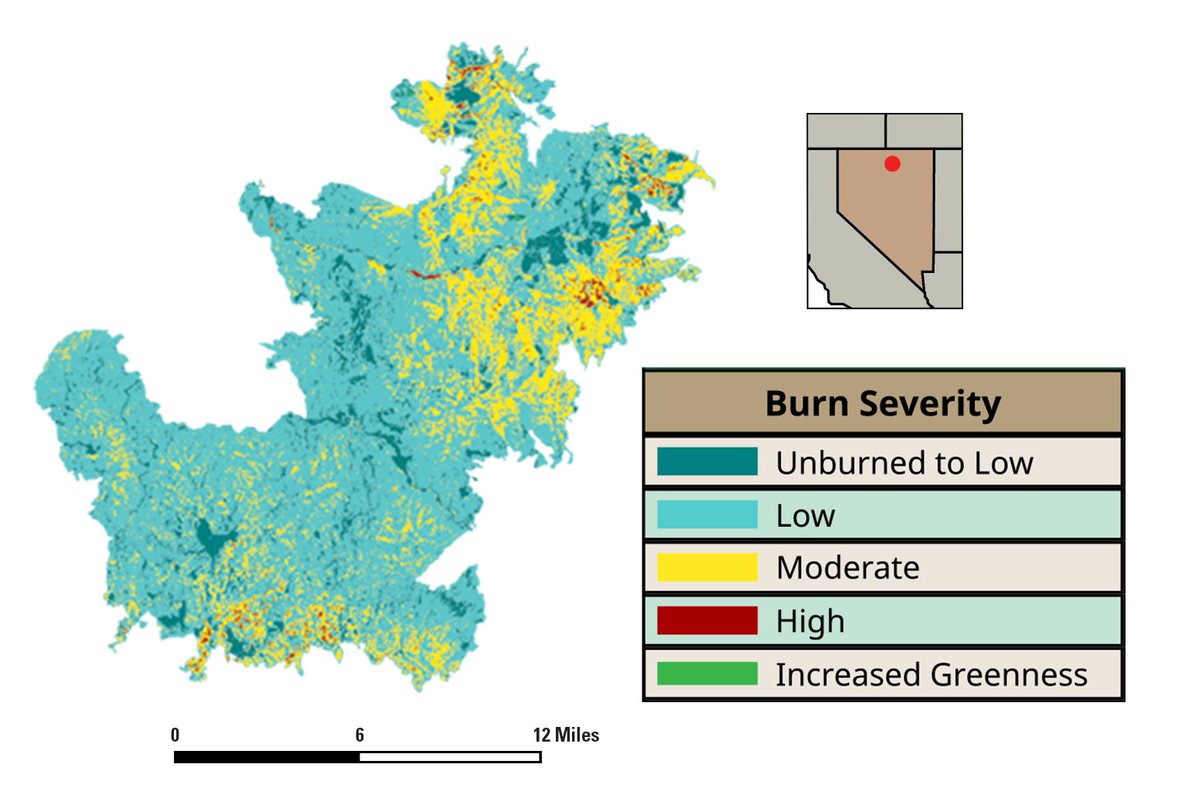
Every wildfire leaves a signature on the landscape. More than 200 new maps now help tell that story. 🔥
Long-term fire records help scientists and land managers understand how burned landscapes change over time and prepare for future fires.
The Monitoring Trends in Burn Severity (MTBS) program recently added more than 200 fire maps, extending its record from 1984 through 2025. With an archive of more than 30,000 maps, MTBS data support land management decisions and are widely used in scientific research.
Check out the latest MTBS fire maps on this interactive viewer: https://t.co/iy4gxUeaMN
📷1: This photo taken August 18, 2025, shows smoke billowing from the Cottonwood Peak Fire. Photo credit: Forrest Peterman, Bureau of Land Management
📷2: One of the new MTBS maps includes the Cottonwood Peak Fire ignited by lightning in August 2025; it grew to be the largest wildfire of the year in Nevada. The fire burned more than 137,000 acres of sagebrush and grass, along with some forest, in Elko County. About 1,000 people worked on the fire, which threatened ranches and prompted evacuations. The map shows varying levels of burn severity and the fire’s location in north central Nevada. Credit: USGS
#wildfire #FireMapping #BurnSeverity
AI and satellite imagery help emergency teams respond to natural disasters.
After the Venezuela earthquakes, NASA, Microsoft and the EU's Copernicus programme used AI and satellite data to assess building damage and help direct rescue efforts.
#FrAIday🔗 https://t.co/2j9pQpMuny
The planet’s thermostat was set to high this #June2026. 🌡️ From record-high ocean temps to a busy storm season, June 2026 was the second-warmest on record with a top-10 low sea ice extent.
See the full report: https://t.co/b1wOm7U2iY
🌡️June 2026 was the hottest June ever recorded in western Europe
Today, @CopernicusECMWF announced that June was indeed an exceptionally hot month.
Looking at data from our service, CLMS, we can also see that the second half of June became exceptionally hot.
More info👇
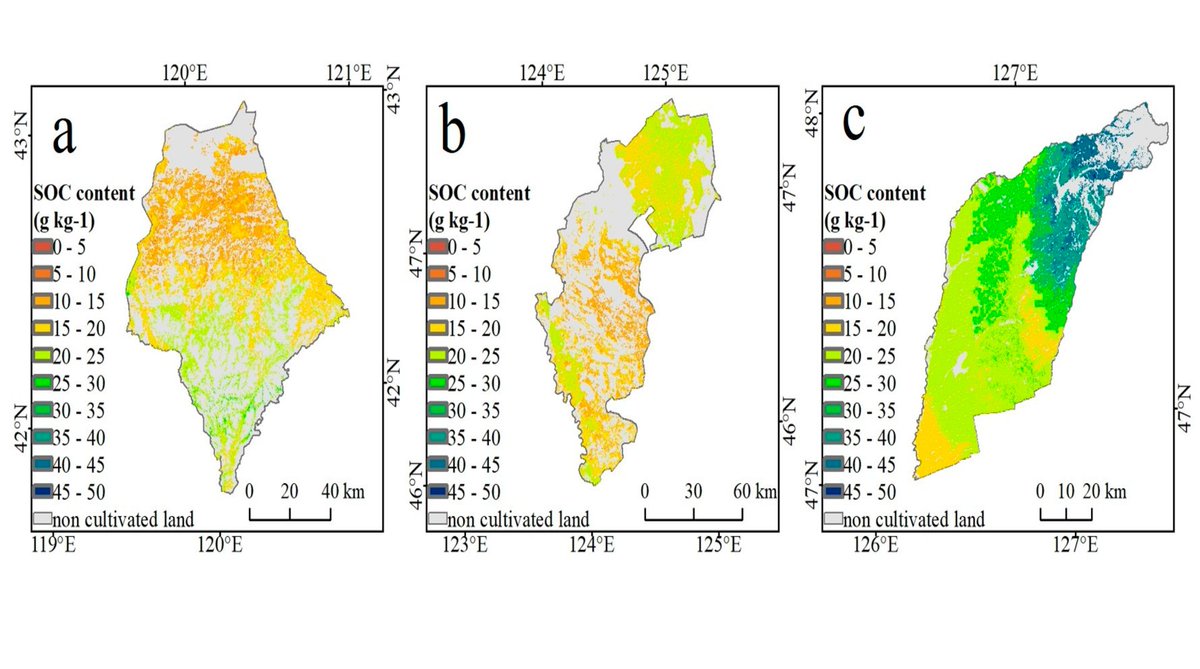
👋👋 Identifying Optimal Variables to Predict #Soil#Organic#Carbon in Sandy, Saline, and Black Soil Regions: Remote Sensing, #Terrain, or #Climate Factors?
✍️ Liping Wang et al.
🔗 https://t.co/KdtC9Ioei7
👉👉 Research on Mass Center Identification for #Gravitational#Wave Detection #Spacecraft with Guaranteed #Laser Link Pointing Accuracy
✍️ Shen-Ao Wang et al.
🔗 https://t.co/zwMAE6EvX1
🌡️ Western Europe recorded its warmest June on record in 2026.
📈 According to the latest #CopernicusEU Climate Change Service bulletin, temperatures peaked at +9°C above avg across parts of 🇫🇷 and 🇩🇪 during the late-June heatwave.
🔗 https://t.co/tW12y1cXDg
#ImageOfTheDay