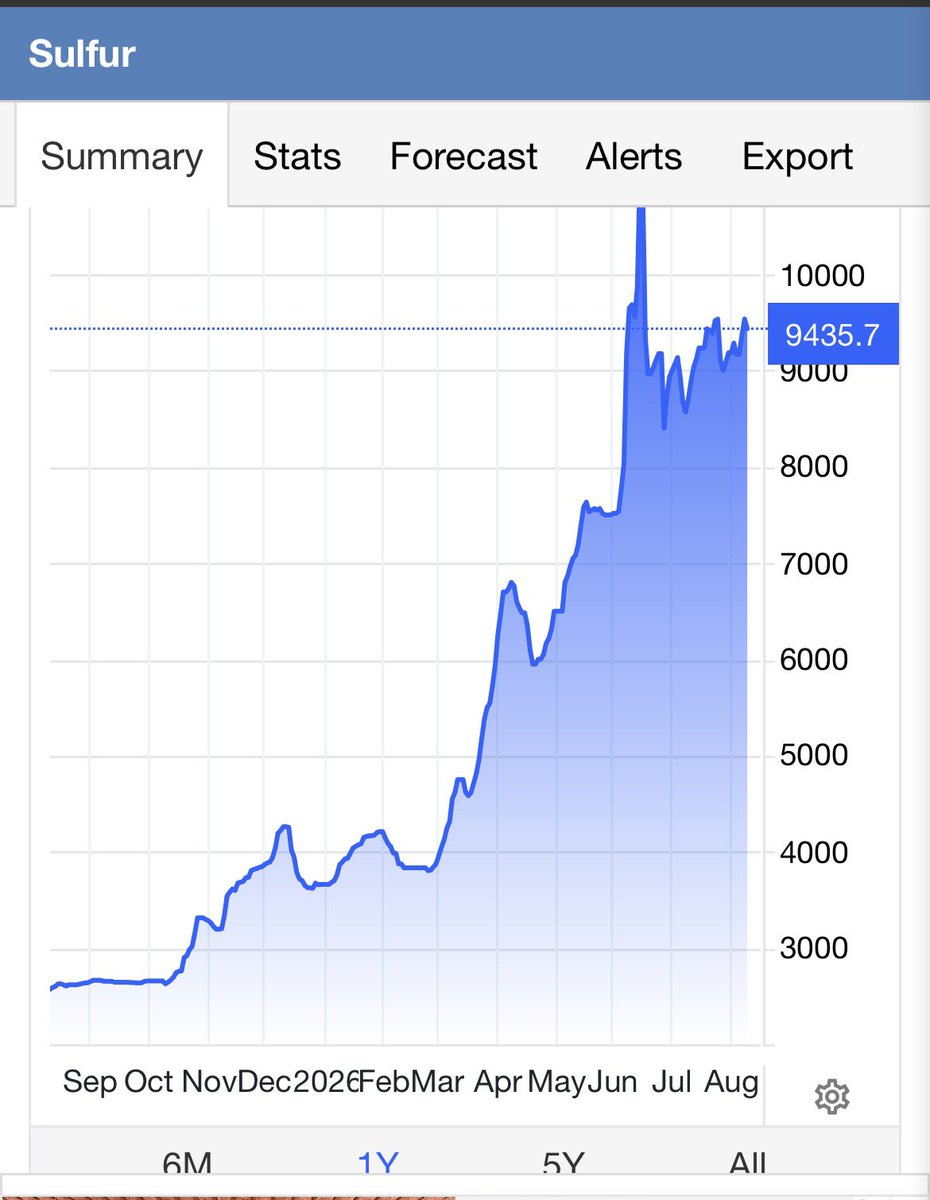
Fertiliser pricing update: urea prices have eased as US supplies eased the market. But the Middle East situation is leading to very high sulphur and phosphate prices.
Market risks are climbing and the bulls are being challenged. Some are hoping for a TACO moment, and now TACO indicators exist to help quantify de-escalation potential. Obv this is more art than science, but Nomura's indicator is at its highs since the late March bottom.
🚢 Watch this in real time: tanker crossings at Bab el-Mandeb following the Houthi strikes on Saudi ships.
Our chokepoint trackers update every 30 min (24h rolling), so you'll see any pullback as it develops.
Chart it, set alerts, or run any other analysis — all on @TheTerminal.
It's early, but the latest readings are showing some slowing:
Analysts at Signum Global Advisors led by Andrew Bishop have created a "TACO index" to attempt to discern when Pres Trump might de-escalate the Iran situation.
The index is comprised of Brent crude, the 10-year yield, the number of Hormuz crossings, and the SPX.
In backtesting they found that a 2.3 to 3.4 standard deviation move — or an average of 2.9 standard deviations -- has seen action from the President in the past.
Putting that in today’s terms, the analysts find it’s not yet time to TACO — but it’s getting closer. “Extrapolating linearly would suggest that a TACO could happen as early as July 22 and ‘should’ happen no later than July 30 (unless conditions materially improve, which seems unlikely) – with history suggesting July 26 as most likely,” they said.
Tanker traffic through the world's 3 great chokepoints (30D MA) 🛢️ 🌊
⛔ Hormuz: ~97% collapse after March — from ~65 tankers to ~2. Flatlined for 3 months, only now limping back to 11.
🚢 Suez & Bab el-Mandeb: healing, but still ~30–40% below their pre–Red Sea crisis norm.
🚢 With escalation in the Middle East driving demand for chokepoint vessel-crossing data, ECAN on @TheTerminal now adds real-time trackers for the Suez and Panama Canals — joining Hormuz and Bab el-Mandeb — each broken out by direction and vessel type, in both vessel counts and tonnage. (See charts)
Data updates every 30 minutes on a 24-hour rolling basis.
🚢The Houthis just declared a maritime ban on Saudi Arabia, "effective immediately," per spokesman Yahya Saree, in retaliation for what they call the kingdom's siege on Sana'a. We've seen this movie before, so here's what happened to shipping the last time this chokepoint came under fire.
Along with Hormuz, we track this chokepoint live too on @TheTerminal , a dedicated Bab-el-Mandeb crossings ticker, updating every 30 minutes on a 24-hour rolling basis, so you can watch traffic move in real time as this plays out.
Bab-el-Mandeb is the southern gate to the Red Sea and the Suez Canal — roughly 12% of global trade. From 2021 through 2023 it ran a steady ~75 commercial vessels a day. Then the Houthis opened fire in November 2023, and on December 15 a Maersk boxship was hit — and the floor gave way. Within days every major line — Maersk, MSC, CMA CGM, Hapag-Lloyd, ONE, Evergreen — suspended Red Sea transits and rerouted around Africa, adding about two weeks to every voyage. Crossings fell ~60%, bottoming near 30 a day through 2024.
📉 That's the cliff in the chart.
What's striking is how the market split in two. Oil shrugged it off — Brent was ~$81 in early November 2023 and actually lower by mid-January 2024, thanks to OPEC spare capacity, soft China demand, and the fact that the Houthis mostly spared tankers. Containers were the opposite: Shanghai–N. Europe box rates quadrupled in eight weeks, war-risk insurance jumped roughly tenfold, and Egypt lost around $10B in Suez tolls in 2024.
It quieted in early 2025, flared again in July when two Greek bulk carriers were sunk, then stopped after the October 2025 Gaza ceasefire — Maersk restarted Red Sea runs in January 2026. Today crossings are back near ~40/day: recovering, but still ~40% below the pre-crisis norm.
Bloomberg Economics just decomposed the entire oil move since January.
Supply, not demand, has driven almost all of it.
Every spike lines up with a supply event.
The Iran war beginning, the ceasefire, the Hormuz toll announcement.
Demand contribution has actually turned negative in recent weeks.
https://t.co/FnWkWuivTS
For every barrel of physical crude that trades, 50 barrels of paper crude trade on CME, ICE, and OTC books.
That ratio is why oil crashed for 3 weeks even though nothing physical broke.
Refined product was still short.
Russian refineries were still under attack.
Chinese storage was still drawing down.
Money managers flipped net short WTI for the first time on record.
That was positioning, not fundamentals.
I did not sell into that drop.
The paper market got ahead of itself. The physical just reasserted.
https://t.co/CRro3tW9jc
1/ Every trader talks about "quant." But what is quant data?
It's simply data that can be measured, analyzed, and tested helping traders make decisions based on evidence instead of opinions.
Here's why it matters.