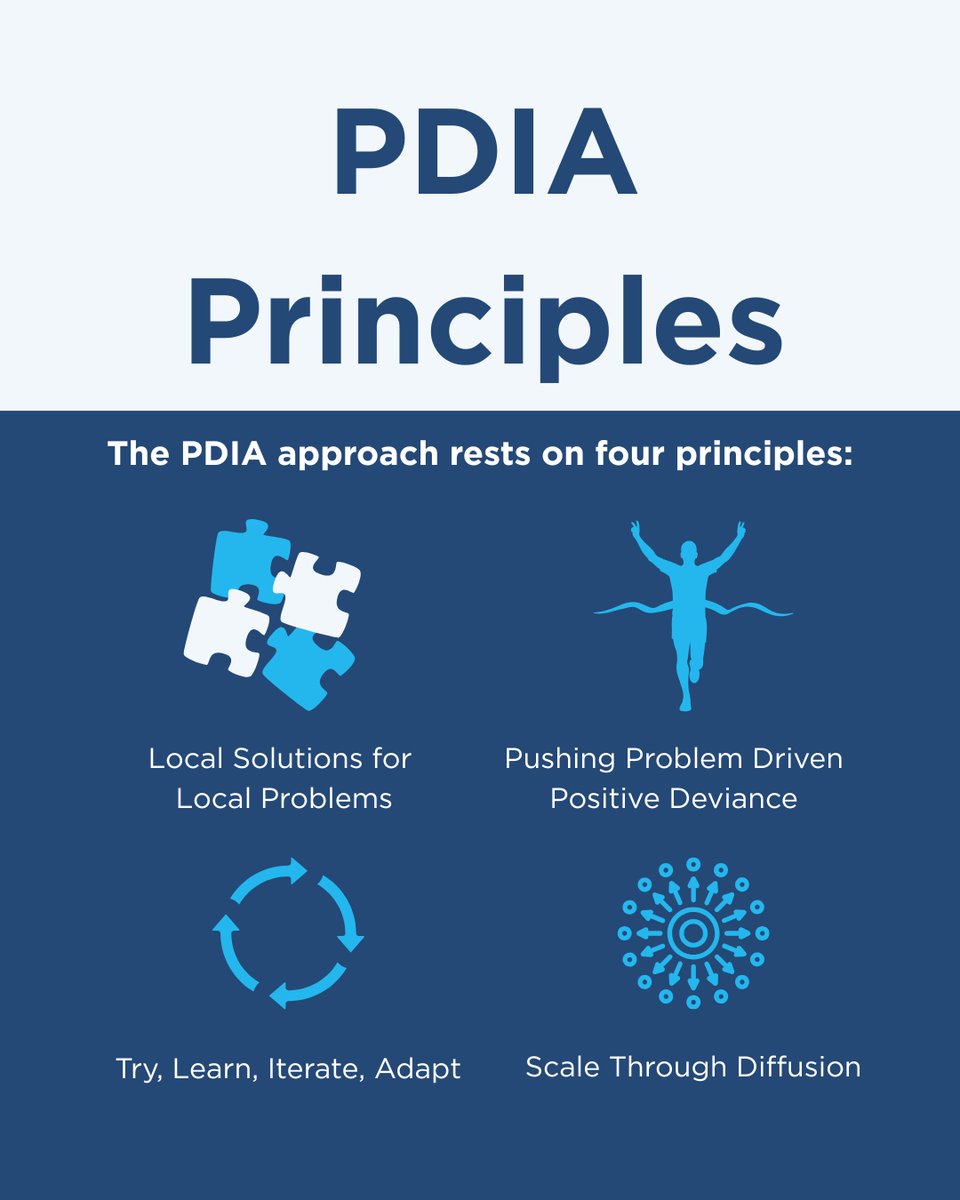
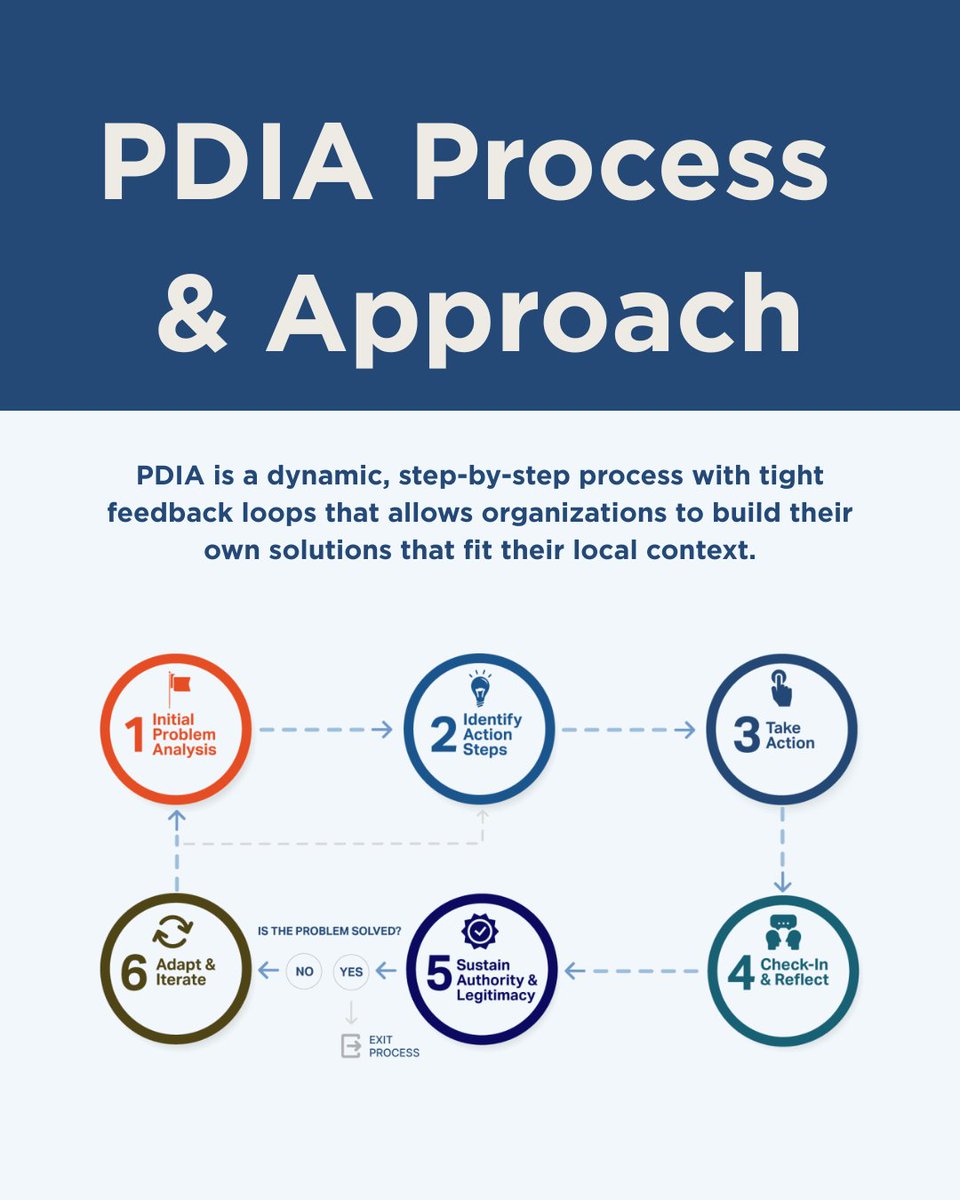
PDIA is mentioned often by BSC leaders and practitioners—but what is it?
It's a step-by-step, dynaminc approach with built-in feedback loops to solve complex problems.
Explore its principles, process, and tools.
Learn more: https://t.co/V9AxuBGynE
Evidence–Based Technical Analysis.
David Aronson's Evidence–Based Technical Analysis will change how you see trading.
Here’s a full breakdown - so you don’t have to read all 544 pages.
Be sure to save this thread:
3-phase research writing method you NEED to know ⤵️
Save it for your next manuscript using 𝘤𝘭𝘪𝘱𝘱𝘦.𝘮𝘦 & Repost to to help your network!
MAKE IT
— Start with your main finding
— Write methods while they're fresh
— Drop raw results in tables/figures
— Build your story around the data
CHECK IT
— Read it backwards (seriously)
— Get feedback before submission
— Compare to papers you admire
— Remove 50% of your adjectives
POLISH IT
— Make figures tell the story
— Cut anything not supporting your point
— Read it out loud (catches 90% of issues)
— Let it sit for 3 days, then edit again
----------------
𝗙𝗼𝘂𝗻𝗱 𝗶𝘁 𝘂𝘀𝗲𝗳𝘂𝗹?
1. Save the post with 𝘤𝘭𝘪𝘱𝘱𝘦.𝘮𝘦
2. 🔄 Retweet to help your network
3. Follow @RaziaAliani to get useful Research content
4. Receive exclusive FREE tips on using AI in research ⤵️
🔗 below my name
One book every aspiring data scientist should own.
It's over a decade old. And it's still the Number 1 book for learning statistics and data science.
This is why.
📣 Submit your papers now for our conference with @UCStoneCenter and the Institute for Applied Economic Research.
We invite scholars whose papers address inequality and mobility in cross-cultural contexts.
🔗 Submit here: https://t.co/xZOA9YWrPW
📅 Deadline: 19 March 2025
Here are three books that challenge the work by last week's winners of the Nobel prize in economics.
In different ways, all these books highlight the shortcomings of the West's model of 'good governance'.
⏳ Deadline Alert! Only 1 week left to apply for 'Evaluating Social Programs 2024'!
Learn how to measure and improve the social impact of your programs through evidence and data!
🔗Apply before Oct 4: https://t.co/fuEPEuAwpX
Teaching stats and R using our textbook for complete beginners, Data Analysis for Social Science (https://t.co/GBZa6V1QGG)? #rstats
Here are some instructor RESOURCES for you:
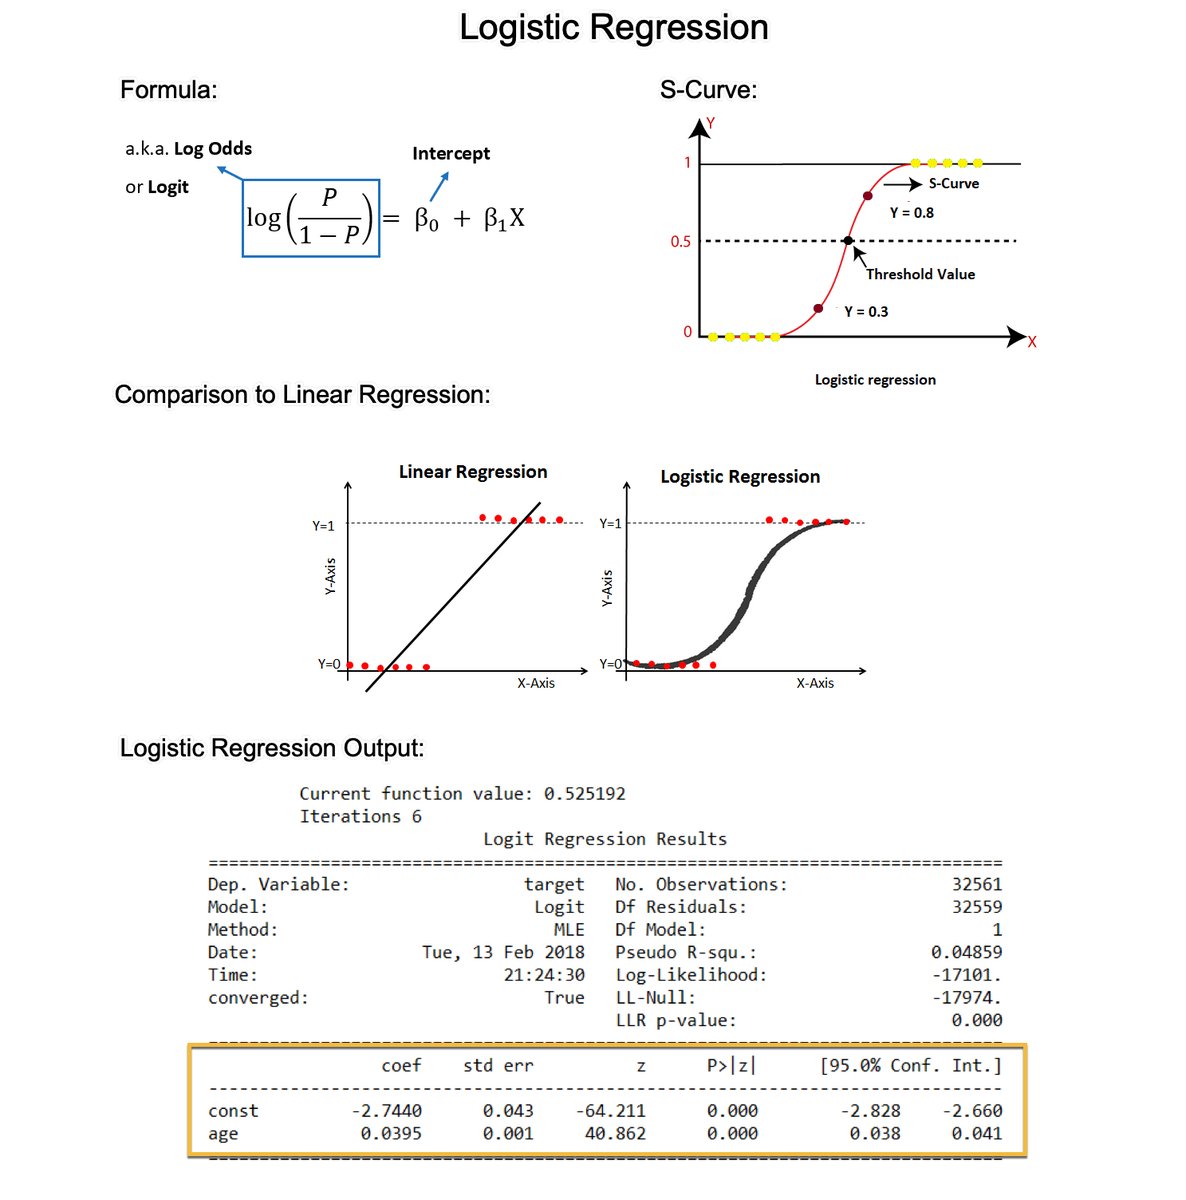
Logistic Regression is the most important foundational algorithm in Classification Modeling. In 2 minutes, I'll teach you what took me 2 months to learn. Let's dive in:
1. Logistic regression is a statistical method used for analyzing a dataset in which there are one or more independent variables that determine a binary outcome (in which there are only two possible outcomes). This is commonly called a binary classification problem.
2. The Logit (Log-Odds): The formula estimates the log-odds or logit. The right-hand side is the same as the form for linear regression. But the left-hand side is the logit function, which is the natural log of the odds ratio. The logit function is what distinguishes logistic regression from other types of regression.
3. The S-Curve: Logistic regression uses a sigmoid (or logistic) function to model the data. This function maps any real-valued number into a value between 0 and 1, making it suitable for a probability estimation. This is where the S-curve shape comes in.
4. Why not Linear Regression? The shape of the S-curve often fits the binary outcome better than a linear regression. Linear regression assumes the relationship is linear, which often does not hold for binary outcomes, where the relationship between the independent variables and the probability of the outcome is typically not linear but sigmoidal (S-shaped).
5. Coefficient Estimation: Like linear regression, logistic regression calculates coefficients for each independent variable. However, these coefficients are in the log-odds scale.
6. Coefficient Interpretation (Log-Odds to Odds): Exponentiating a coefficient converts it from log odds to odds. For example, if a coefficient is 0.5, the odds ratio is exp(0.5), which is approximately 1.65. This means that with a one-unit increase in the predictor, the odds of the outcome increase by a factor of 1.65.
7. Model evaluation: The evaluation metrics for linear regression (like R-squared) are not suitable for assessing the performance of a model in a classification context. For Logistic regression, I normally use classification-specific evaluation metrics like AUC, precision, recall, F1 score, ROC curve, etc.
There you have it- my top 7 concepts on Logistic Regression Models. The next problem you'll face is how to apply data science to business.
I'd like to help.
I’ve spent 100 hours consolidating my learnings into a free 5-day course, How to Solve Business Problems with Data Science. It comes with:
300+ lines of R and Python code
5 bonus trainings
2 systematic frameworks
1 complete roadmap to avoid mistakes and start solving business problems with data science, TODAY.
👉 Here it is for free: https://t.co/YXG4pL97ZN
🚀Ready to elevate your #evaluation career?
At #Eval4Action Youth in Evaluation week 2024, join this X Space dialogue on evaluation career paths, networking, job market & the latest #evaluation trends!
🗓️10 Jul, 10am. Bookmark here🎙️https://t.co/YDzrSX5aCB
🚀 Comenzó la Conferencia Internacional de Evaluación: Transformando la Evaluación: Un Compromiso con la Inclusión y la Sostenibilidad.
Organizado por ACEVAL y EQUIDE.
Únete en línea y sé parte de este diálogo crucial para el futuro de la evaluación.
👉https://t.co/DgYDp6kh2X
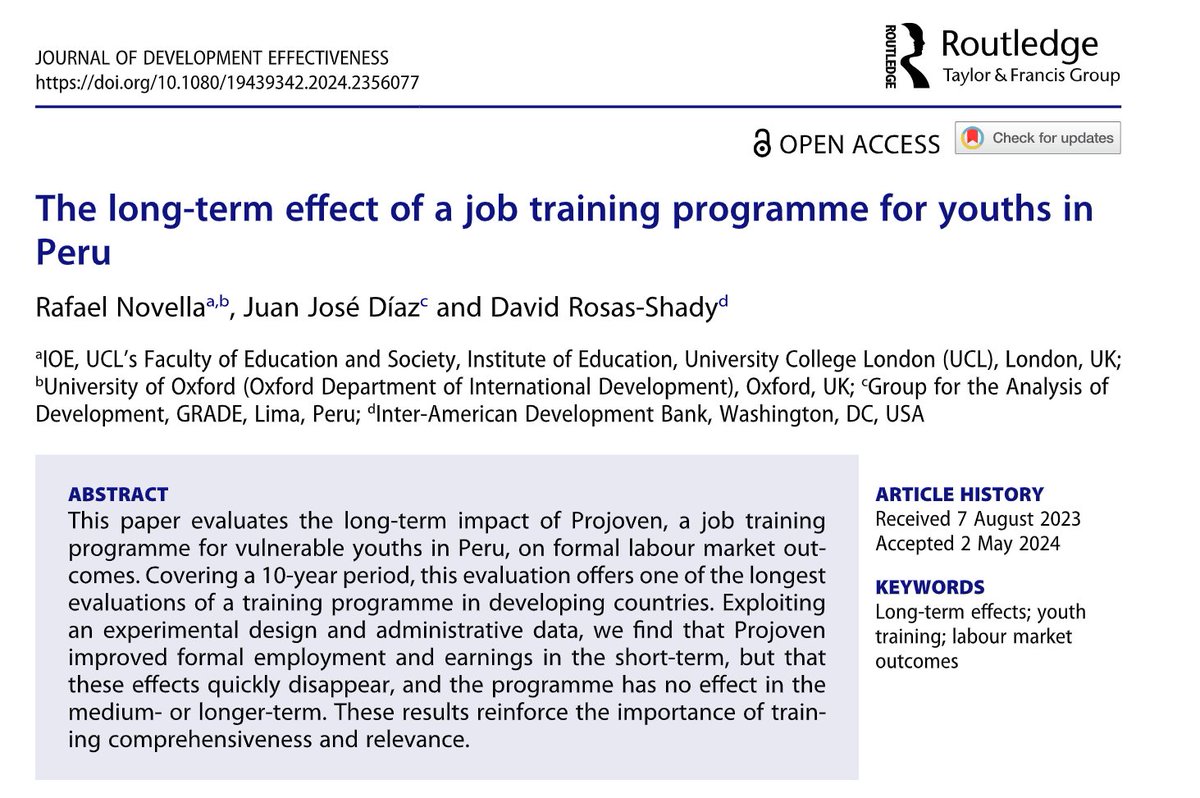
Measuring the impact of interventions over time is crucial!
https://t.co/618WqxJfxR
In Peru, the youth job training program "Projoven improved formal employment & earnings in the short-term, but...these effects quickly disappear" with no discernible impacts after the 1st year.
Prof @Tari_Turner breaks down when we do not need living evidence in evidence-based healthcare.
Learn more from Tari's presentation from #JBIiGNITE on our YouTube channel at https://t.co/LKsV0MllJy