July 2023 was the hottest month on record, according to our global temperature analysis. Overall, July was 0.43°F (0.24°C) warmer than any other July in @NASAEarth's record, and it's likely due to human activity. Details: https://t.co/2DTIfL8S1Q
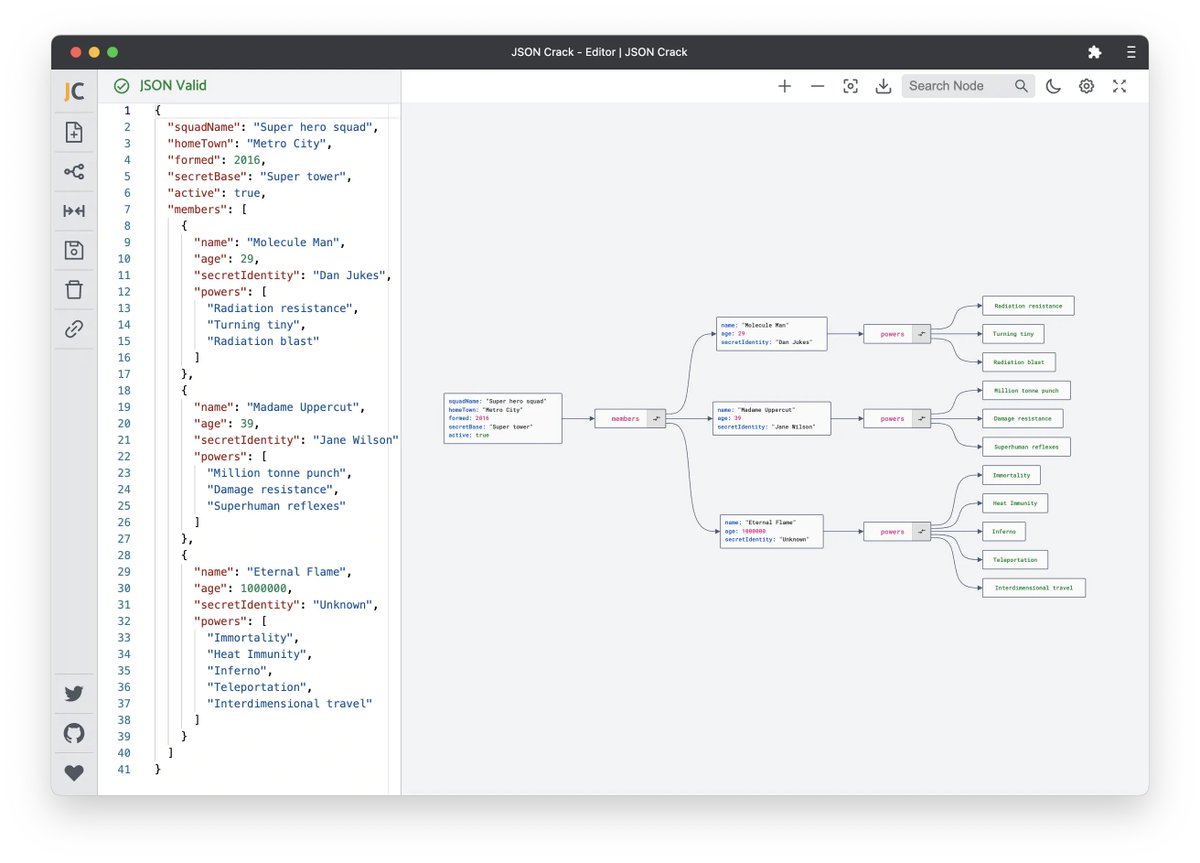
Nested JSON files can easily become difficult to explore manually.
📌 Bookmark jsoncrack .com. It offers a beautiful visualization of JSON files as graphs. It can also be integrated with VScode IDE. Great tool!
Do you need help deciding which chart is a good fit for your data?
#DataFam, I recreated Andrew Abela's Chart Suggestion—A Thought-Starter (with my tweaks) in #Tableau and #figma to help you decide. These #DataViz charts are not exhaustive or compulsory.
https://t.co/LpbnUyJE6O
@juanitopez@enbicipormadrid "las cifras de siniestralidad así lo demuestran", si el uso de la bici es minoritario, los datos de siniestralidad nunca serán un índice comparativo con otras ciudades donde el uso de esta sea alto.
@asiermarques@david_bonilla Información común al equipo/empresa y actualizada por todos los integrantes, centralizar el conocimento. Por ejemplo; wikis, herramientas de ticketing, foros, gestores documentales...¿Usar estas herramientas para "protocolizar" la gestión y búsqueda de información?