#Bitcoin
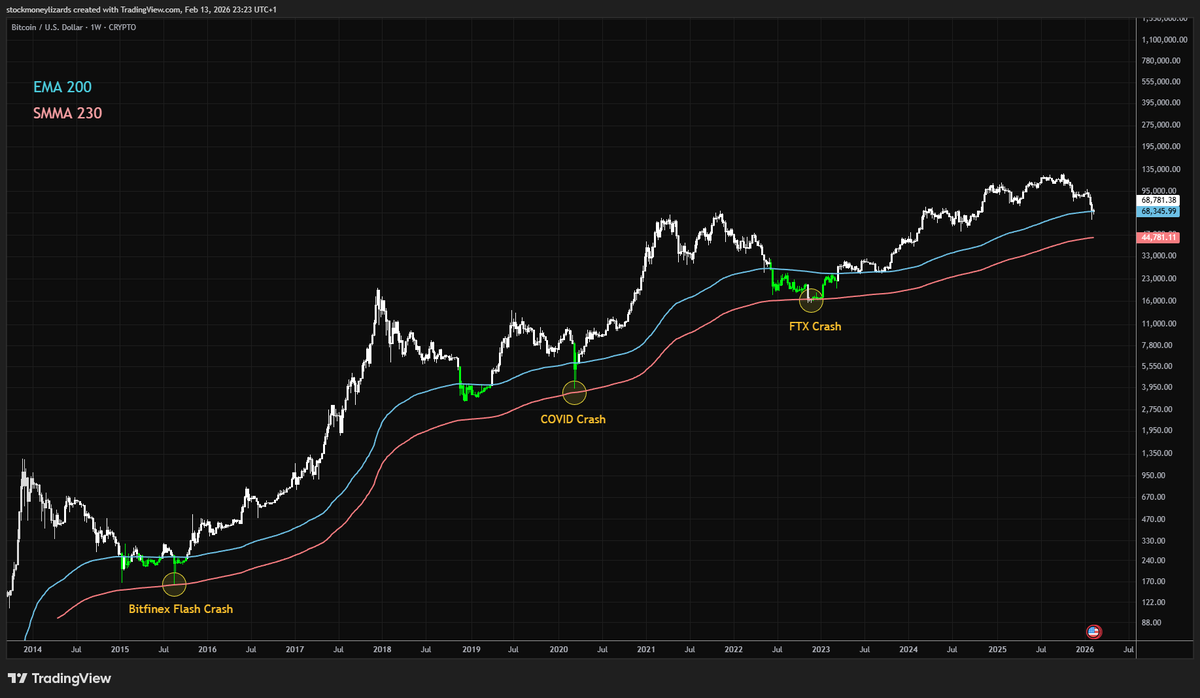
According to this indicator, a bottom is confirmed only when two conditions are met:
- The red line crosses above the blue line
- The red line peaks and starts to roll over
The first condition is getting close.
Reminder
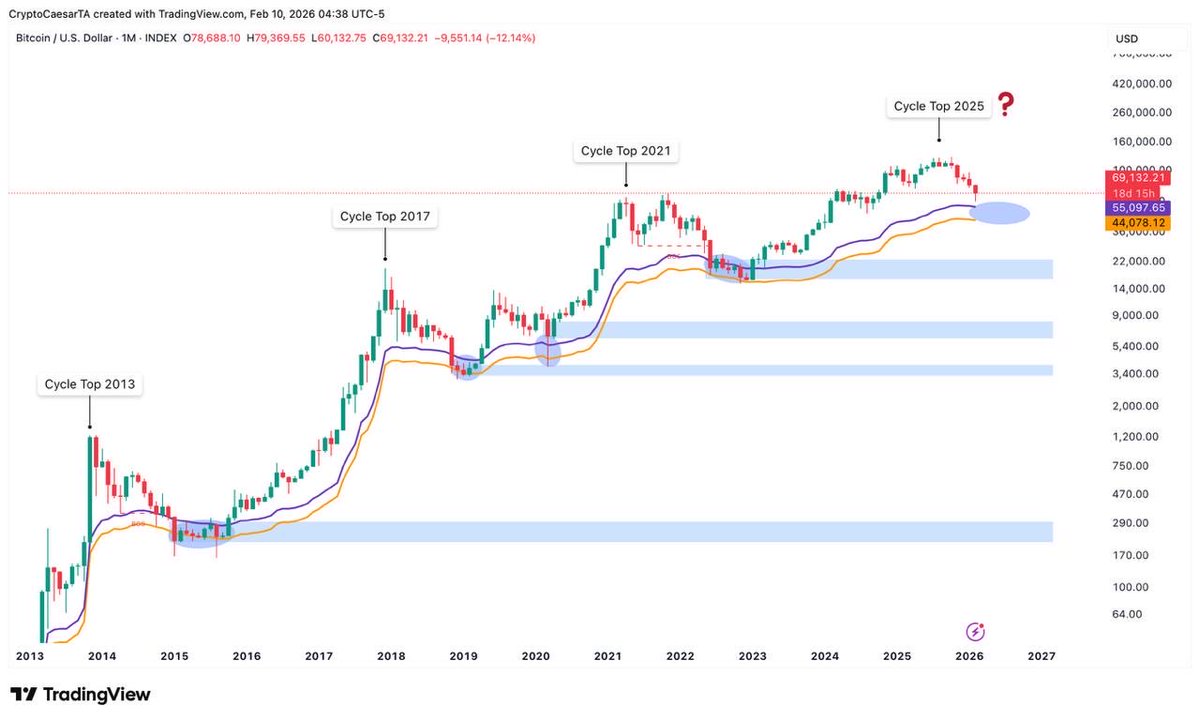
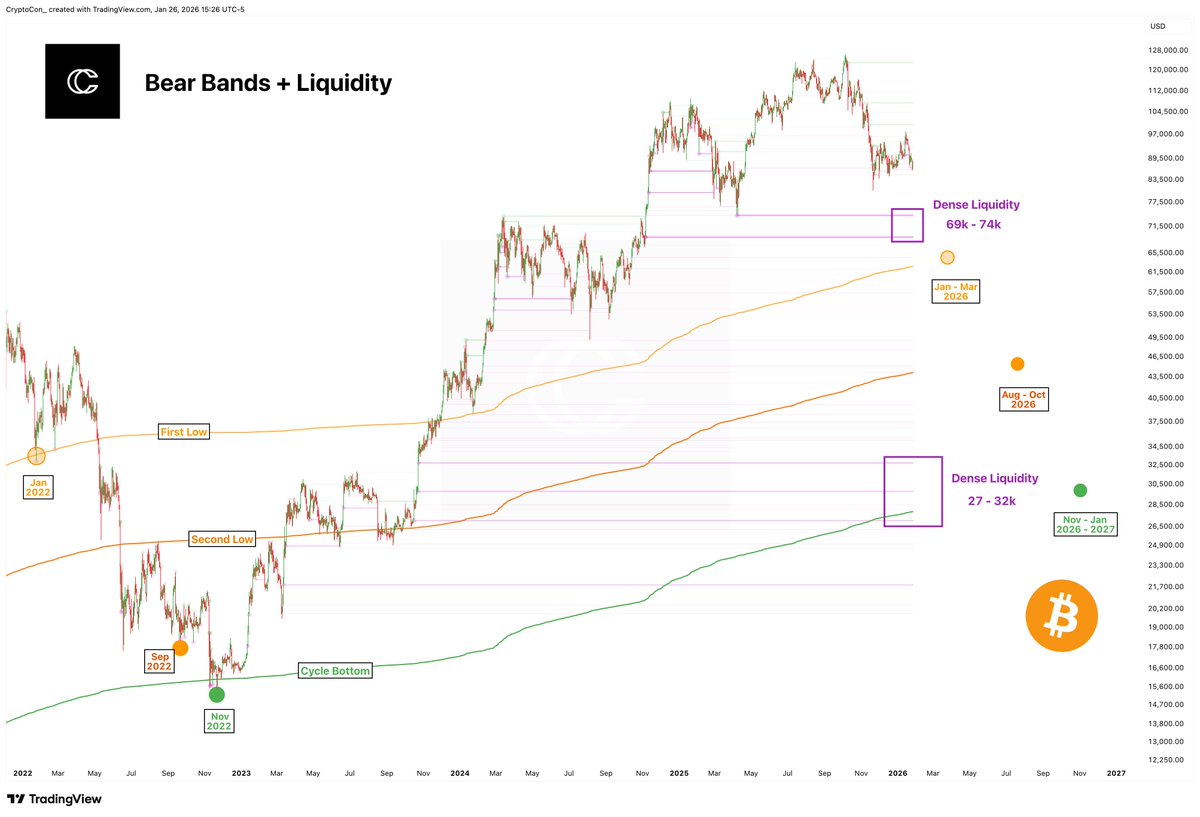
1. Bitcoin usually bottoms between the EMA200 and SMMA230
2. The SMMA230 is the last line defense: This happened 3 times so far in 10 years and each time, it took a black swan events for BTC to retrace that far
3. Each bottom in the past 10 years happened between these two moving averages
Bitcoin might not have found the final bottom. But it has definetely entered and touched the bottom zone.
$BTC (1M) – When to buy Bitcoin
One of the cleanest long-term indicators in Bitcoin’s history: realized price.
This indicator tells us if the average network participant is in a state of profit or loss.
Every cycle tells the same story.
When BTC traded below the realized price (purple line), it marked a clear discount zone for long-term buyers. No exceptions.
Price is now moving back toward that zone again.
A bounce back up is still possible, but once Bitcoin enters it, I’ll start DCA’ing back in, adding to my long term bag.
Every now and then I share charts people usually charge money for.
Turn on notifications, this can genuinely be life-changing.
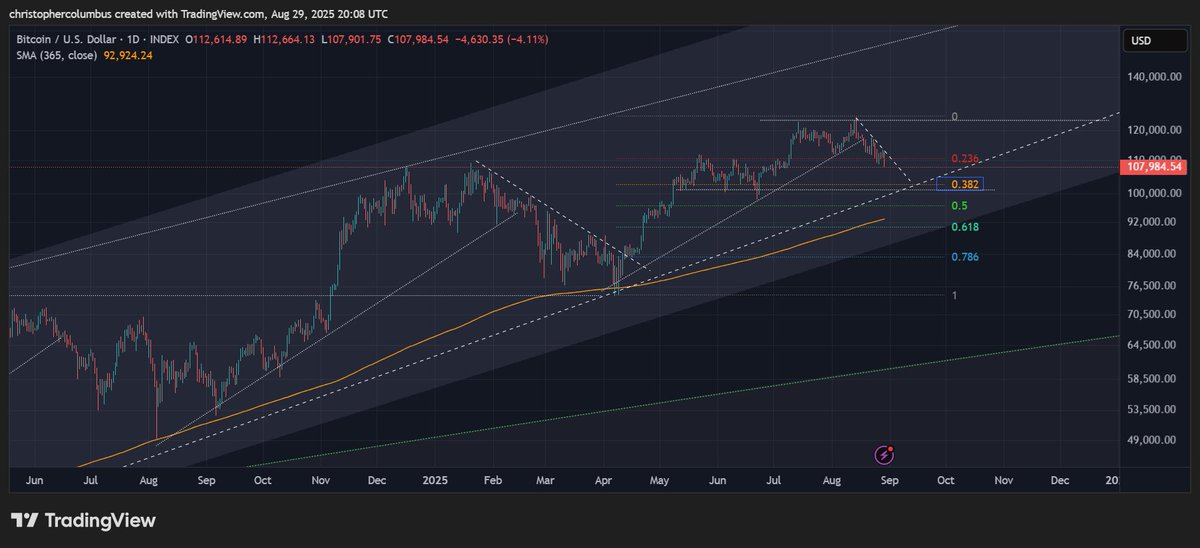
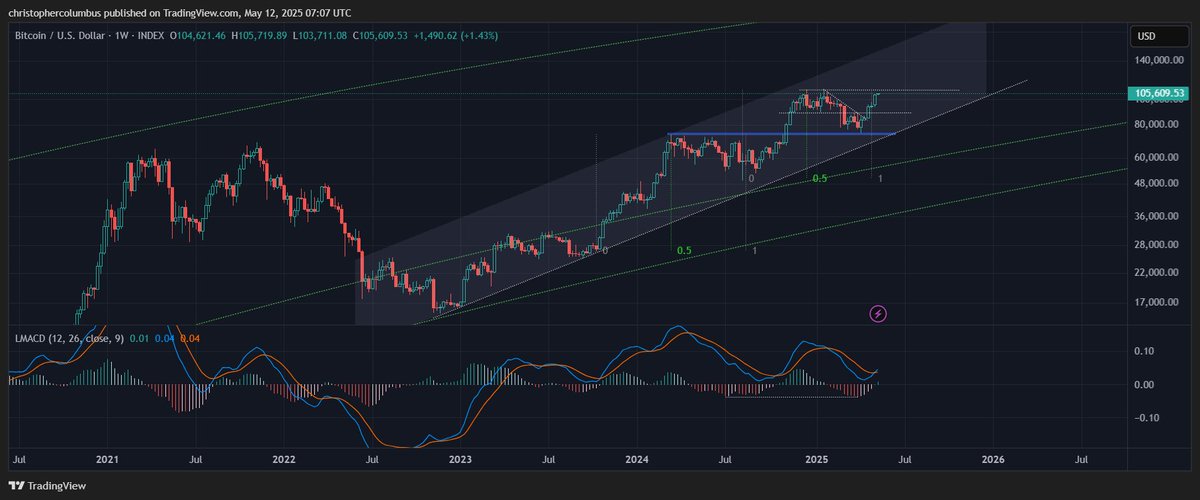
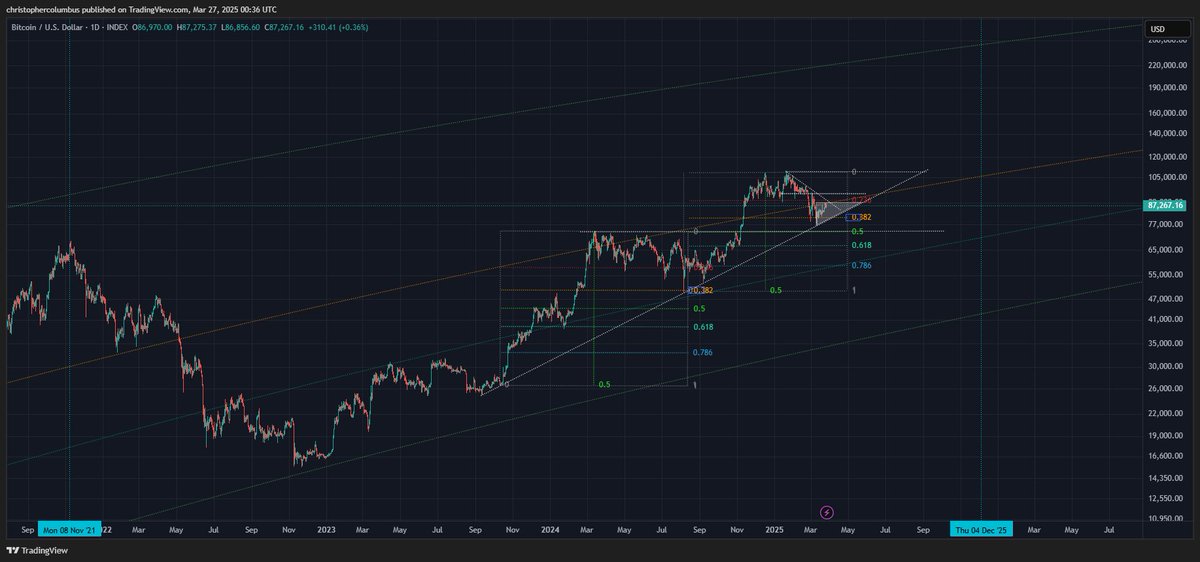
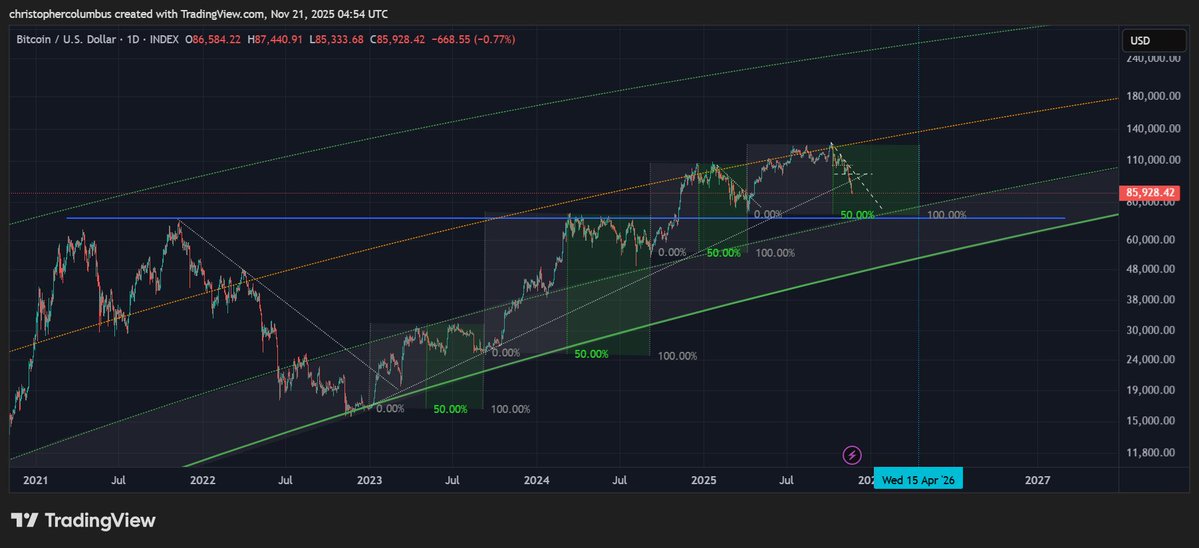
#bct effectively tracking the 1 year moving average... and consistent with the logarithmic growth curve [explosive gains early on then increasingly plateauing].
Maturing market.
The LGC same curves since 2018.... and where price couldn't currently be better placed.
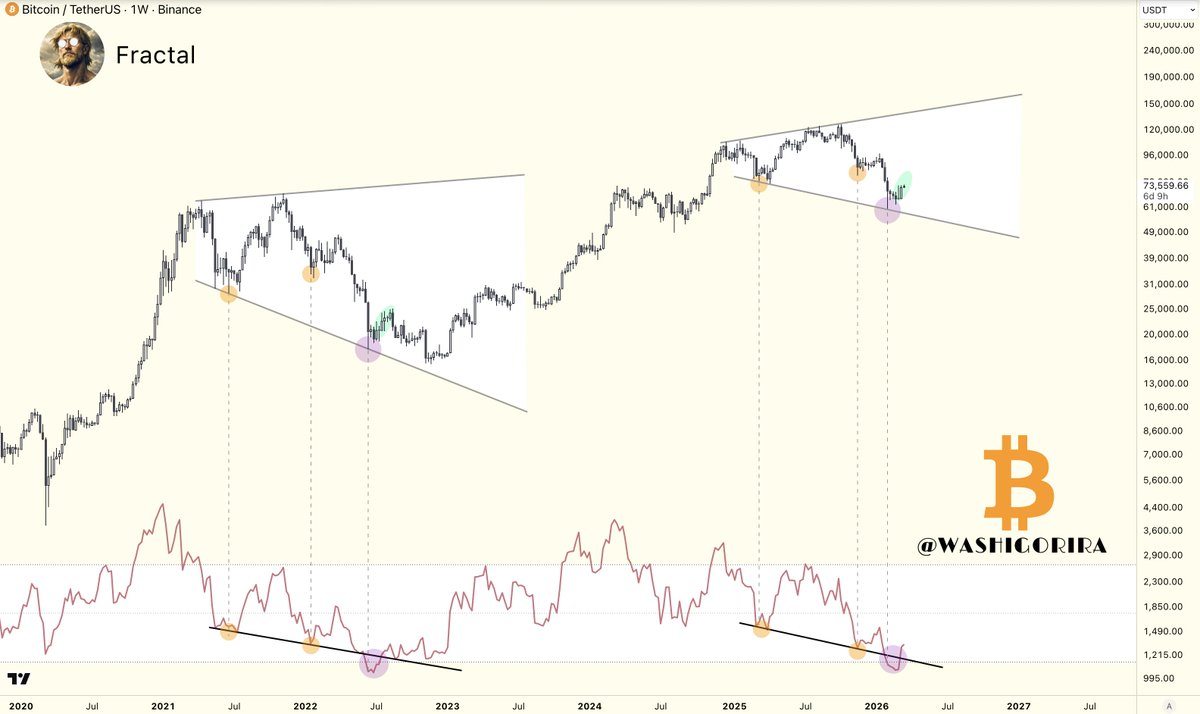
4 year #btc cycle theory about to be tested.
If the triangle breaks up, it's still on.
If the triangle breaks down, more likely not.
Does not affect the LGC model.🧐









![davthewave's tweet photo. #bct effectively tracking the 1 year moving average... and consistent with the logarithmic growth curve [explosive gains early on then increasingly plateauing].
Maturing market.
The LGC same curves since 2018.... and where price couldn't currently be better placed. https://t.co/wLaeZOZTwU](https://pbs.twimg.com/media/G19r83RaAAAd9UH.jpg)