🌍 Journée mondiale de l'environnement : un appel à agir pour le climat !
Découvrez une sélection de ressources et d'actions pour permettre aux élèves de mieux comprendre le changement climatique et de s'engager pour un développement durable ⤵
https://t.co/akcP5HjAc0
Jour 111, orbite 1722 – Dans ce timelapse, je travaille sur une expérience appelée DNA Therapeutics dans la boîte à gants LSG du module Kibo. Je manipule des échantillons de cellules souches sanguines dans le cadre de recherches visant à comprendre comment produire de plus grandes quantités de cellules souches de qualité clinique dans l’espace. L’objectif est d’en améliorer la qualité, ce qui pourrait contribuer à faire progresser les traitements des maladies du sang et du cancer.
Vive la science et la recherche contre le cancer !
🎥 @esa / @NASA
#εpsilon • @esaspaceflight • @esa_fr • @Space_Station • @NASAJohnson • @NASA_Marshall • @UConn • @Axiom_Space
California’s tomato fields can now be identified from space with 99% accuracy using 64 numbers for every 10-metre patch of land.
No custom vegetation index. No hand-built crop calendar. No months spent tuning a satellite pipeline around clouds, missing dates, and sensor quirks.
A new paper tests a simpler workflow: take Google DeepMind’s AlphaEarth embeddings, train a U-Net on labelled fields, and ask it to separate processing tomatoes from everything else.
The dataset is a good stress test. The researchers used 9,484 field polygons from California’s 2018 LandIQ crop maps: 4,742 processing tomato fields and 4,742 non-tomato fields.
The comparison class wasn’t easy. It included alfalfa, wheat, corn, beans, orchards, and other crops that can look similar in satellite imagery at different points in the season.
Each field became an image chip. But instead of raw RGB or a stack of hand-crafted indices, every 10-metre pixel came with 64 AlphaEarth values.
Those 64 values are the interesting part. They don’t map neatly onto red, green, blue, NDVI, moisture, radar backscatter, or any single physical measurement. They’re a learned summary of how that location looked and behaved across multiple sensors and time periods.
That changes the crop-mapping problem.
Traditional remote sensing often begins with raw satellite data, then spends a lot of effort cleaning and engineering it. Clouds need masking. Time series need aligning. Missing observations need filling. Analysts build indices, choose seasonal windows, and tune the pipeline for the crop and region.
AlphaEarth moves much of that work upstream. It compresses multi-sensor Earth observation data into a compact annual representation. The downstream model starts from a richer description of the land, rather than trying to reconstruct the full seasonal signal from scratch.
For processing tomatoes, that signal is useful. Tomato fields have a distinctive rhythm: planting, canopy growth, irrigation, harvest timing, field geometry, and management patterns. A single image can miss that. A simple vegetation index can flatten it. A learned annual embedding can carry more of the fingerprint.
The researchers trained a 64-channel U-Net segmentation model. Instead of assigning one label to a whole field, it predicted tomato versus non-tomato at the pixel level.
They also used a spatially independent test set: 1,424 fields from unseen locations. That detail matters because nearby farms can share soils, irrigation systems, management practices, and landscape context. A random split can make agricultural models look better than they are.
The results were extremely strong.
Pixel accuracy: 99.19%, precision: 98.69%, and recall: 99.40%.
But the model wasn’t merely detecting farmland. It was tracing tomato fields against a negative class that included visually similar crops.
The most useful part may be the uncertainty test.
The researchers kept dropout active during inference and ran each chip through the model 100 times. That produced both an average prediction and a variance map.
The uncertainty appeared where you’d expect: field edges, narrow protrusions, irregular boundaries, roads, and mixed pixels. Field interiors were stable. Borders were less certain.
That’s important for practical mapping. A model that says “I’m confident in the centre, check this edge” is much more useful than a clean map that hides its weak spots.
There are limits. The labels come from one year, 2018. AlphaEarth is annual, so this isn’t a real-time crop monitoring system. The balanced training set also doesn’t fully match the messier class imbalance of statewide mapping. Running 100 inference passes for uncertainty adds cost at large scale.
But the direction is clear.
Crop mapping is moving from hand-designed satellite recipes towards learned Earth representations. The analyst’s job shifts from “which index should I build?” to “which labelled task can I train on top of this embedding?”
GeoLibre Desktop v0.7.0 is out.
This release adds a big round of data loading, identify, editing, settings, and processing improvements:
- GPX layers from URL or local file, with waypoints, tracks, and routes loaded as separate selectable layers
- Delimited text layers from URL or local file using longitude and latitude fields
- WFS layer support in the Add Data dialog
- WMS GetFeatureInfo identify support
- Inline attribute table editing
- Wider, scrollable attribute tables and identify popups
- Plugin state persistence in project files
- Whitebox toolbox backed by a managed Python sidecar (700+ geoprocessing tools)
GitHub: https://t.co/VXq8c1o2Nd
Website: https://t.co/7VA2AQoCUc
Live demo: https://t.co/Cq5Mg3ojNQ
#geospatial #opensource
GeoLibre v0.5.0 is out! This update significantly expands data format support, making it easier to work with a wide range of geospatial datasets in a lightweight, modern GIS environment.
Newly supported formats and services include: GeoJSON, Shapefile, GeoPackage, GeoParquet, KML/KMZ, FlatGeobuf, PMTiles MBTiles, GeoTIFF, Zarr, LiDAR point clouds, Gaussian Splatting, and ArcGIS services.
GeoLibre is a lightweight, cloud-native GIS built with MapLibre and Tauri. It runs directly in the browser and is also available as a standalone cross-platform desktop application at only ~30 MB.
GitHub: https://t.co/VXq8c1oACL
Website: https://t.co/7VA2AQpaJK
Live demo: https://t.co/Cq5Mg3oRDo
Feedback, ideas, and contributions are welcome.
#geospatial #opensource #maplibre
Comment expliquer simplement l’intelligence artificielle à des élèves ? Consultez notre sélection de ressources concrètes pour accompagner les équipes. https://t.co/oqSyfSpfR9
#IA#Education
Jour 085, orbite 1316 — Saviez-vous que vous pouvez observer la Station spatiale internationale à l’oeil nu ? Depuis le sol, la Station apparaît comme une étoile très brillante qui traverse le ciel à peu près à la vitesse d’un avion de ligne. Mais contrairement à un avion, elle n’a ni phares, ni feux de position clignotants. Ce sont ses panneaux solaires, orientés pour recevoir la lumière du Soleil, qui la rendent si lumineuse lorsque vous la voyez depuis la Terre.
Pour savoir quand nous passons au-dessus de vos têtes et où nous chercher dans le ciel, rendez-vous sur le site https://t.co/VleZSlmKS4… Je ne pourrai pas vous voir, même si vous faites de grands signes, mais je pense à vous depuis là-haut !
📸 @NASA / @esa – S. Adenot 🎥 ESA (temps réel écoulé: 30 min)
#εpsilon • @esaspaceflight • @NASA_Johnson • @Space_Station • @ESA_fr • @CNES
A dramatic moment captures a space rock striking the Moon’s surface, creating a powerful and sudden impact. The object hits at incredible speed, producing a brief flash and disturbing the lunar surface.
With no atmosphere to slow it down, the Moon is constantly exposed to impacts from space rocks, which have shaped its cratered landscape over billions of years. Events like this are happening all the time, but capturing one clearly is rare.
This moment gives a glimpse into the dynamic nature of space and how even the Moon continues to change.
A brief impact, but a powerful reminder of cosmic activity.
#nasa #space #spacex
Following reports of an in-orbit fragmentation event involving Starlink 34343, HEO tasked its sensor constellation to collect non-Earth imagery of the spacecraft.
The imagery below shows the main structure of the satellite is still intact but tumbling at a minimum of 16 degrees per second about its z-axis. At this resolution, we can only derive single-axis attitude estimation, so the true rotation rate is likely higher.
What makes this collection particularly significant is that we already held pre-fragmentation imagery of Starlink 34343 from two months ago in our catalogue, showing the satellite was stable and in an operating configuration. That historical baseline enables before-and-after comparison to support attribution while offering the context needed to begin assessing potential damage and root cause.
We will continue tasking our constellation against Starlink 34343, with higher-resolution collections planned for further analysis.
See below for body frame definition.
🌍 7 avril 2026
La vue la plus puissante de l'humanité en un demi-siècle 🌕
Pour la première fois au 21e siècle, les humains assistent à nouveau à un lever de la Terre depuis l'espace profond.
Alors que l'équipage de mission Artemis II orbite l'autre côté de la Lune, ils capturent un moment qui transcende la science - un rappel tranquille que toute l'humanité partage une maison fragile et lumineuse.
À plus de 400 000 km, à bord du vaisseau spatial Orion, la Terre émerge au-dessus de l'horizon lunaire - brillant en saphir brillant contre le vide. Vue depuis près du pôle sud de la Lune, notre planète apparaît quatre fois plus grande que la Lune depuis la Terre, brillant de magnitude – 16, bien plus brillante que toute pleine lune que nous avons jamais connue.
🌕 Qu'est-ce qui rend cette vue extraordinaire :
• La terre éclaire doucement les cratères ombrés de la Lune
• Une phase terrestre gibbeuse vivante du point de vue lunaire
• Systèmes nuages tourbillonnants et océans visibles à travers un seul monde tournant
Propulsée par le système de lancement spatial, cette mission n'est pas seulement une étape technologique, c'est un changement de perspective.
De cette distance, il n'y a pas de frontières.
Pas de divisions.
Seulement un petit monde rayonnant qui transporte tous ceux que nous avons connus.
🌌 Parfois, les plus grandes découvertes ne concernent pas l'espace
mais sur la façon dont nous nous voyons à l'intérieur.
#ArtemisII
#Earthrise
#SpaceExploration
#OnePlanet
#DeepSpace
#NASA
Most of the "serene" footage we see is actually a chaotic history of impacts. Every crater is a scar from a cosmic collision that happened millions of years ago!
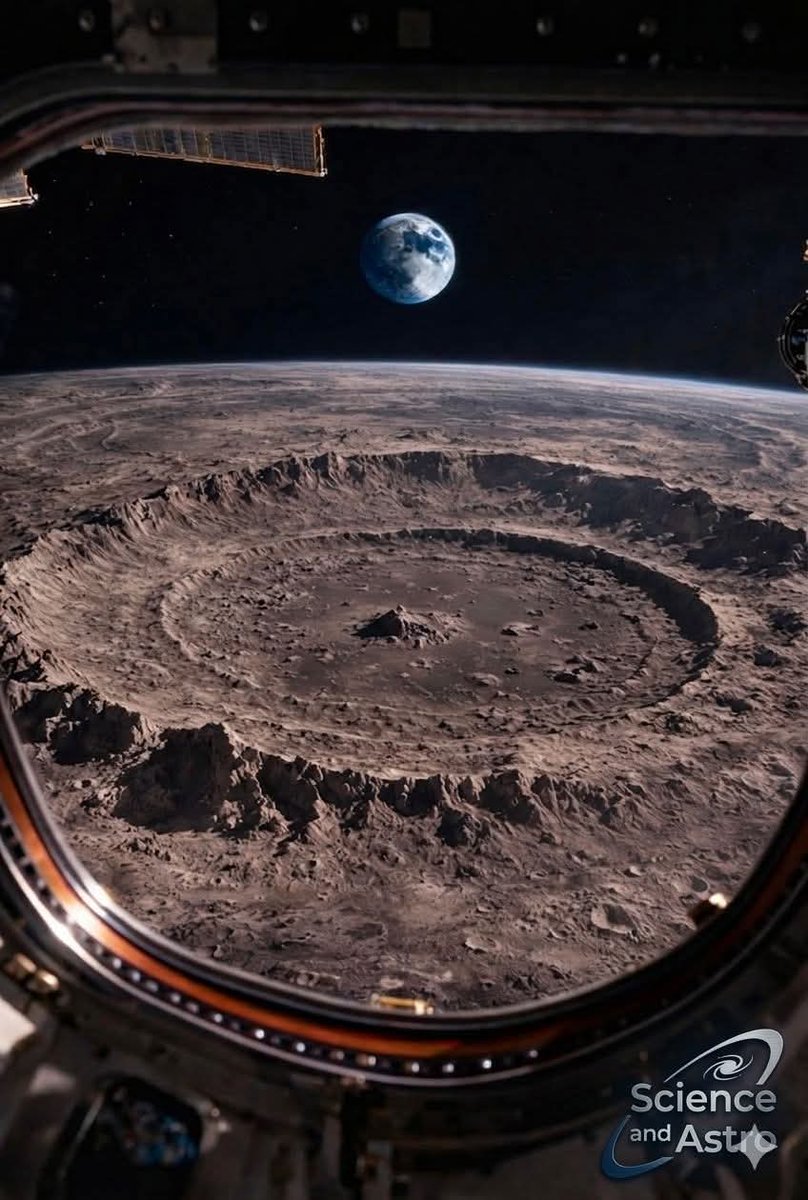
Historic First: Artemis II Crew Becomes the First Humans to Witness the Orientale Basin in Its EntiretyBREAKING: In a stunning milestone for deep-space exploration, the Artemis II astronauts have captured the first-ever view of the Moon’s Orientale Basin with human eyes — seeing its complete, majestic structure for the first time in https://t.co/PDp5ThIn0L the Orion spacecraft swept past the lunar limb during its historic flyby, the crew photographed the entire basin in one breathtaking frame, with Earth hanging beautifully in the black void beyond.A 930-Kilometer Cosmic BullseyeThe Orientale Basin is one of the Moon’s most impressive geological features — a massive multi-ringed impact structure roughly 930 km (580 miles) across. Formed about 3.8 billion years ago by a colossal asteroid or comet strike, its concentric rings ripple outward like frozen waves from a stone dropped into a cosmic pond.The outermost Cordillera ring forms the dramatic outer rim, while inner rings (the Rook mountains) mark zones of dramatic crustal rebound and collapse after the initial impact. Because Orientale straddles the Moon’s near and far sides near the southwestern limb, it has always appeared severely foreshortened and partially hidden from Earth-based telescopes and earlier missions. Only now, from Orion’s unique vantage during the flyby, has the full scale and symmetry been revealed directly to human observers.The Shot of a LifetimeThe image was taken through an Orion window as the crew passed over the site at just the right moment — with perfect illumination highlighting every ridge, ring, and shadow. It’s not just a photo. It’s a pivotal new dataset that complements decades of orbital data from Lunar Reconnaissance Orbiter, GRAIL’s gravity maps, and earlier probes.Entering the Zone of SilenceAs Orion continues its trajectory around the Moon, the crew is now heading into the most isolated phase of the mission: loss of signal. For roughly 40 minutes, the bulk of the Moon will completely block all radio communication with Earth, leaving Reid Wiseman, Victor Glover, Christina Koch, and Jeremy Hansen in profound solitude on the far side.They are venturing where only a handful of Apollo astronauts have gone before — deeper into cislunar space, pushing the boundaries of human exploration farther than any crew since 1970.The Moon is yielding its secrets once again… and humanity is watching live.This is what returning to the Moon — and preparing for Mars — truly looks like.
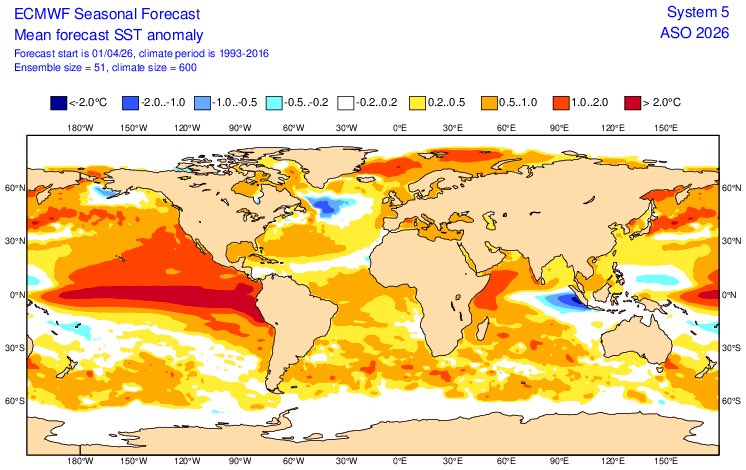
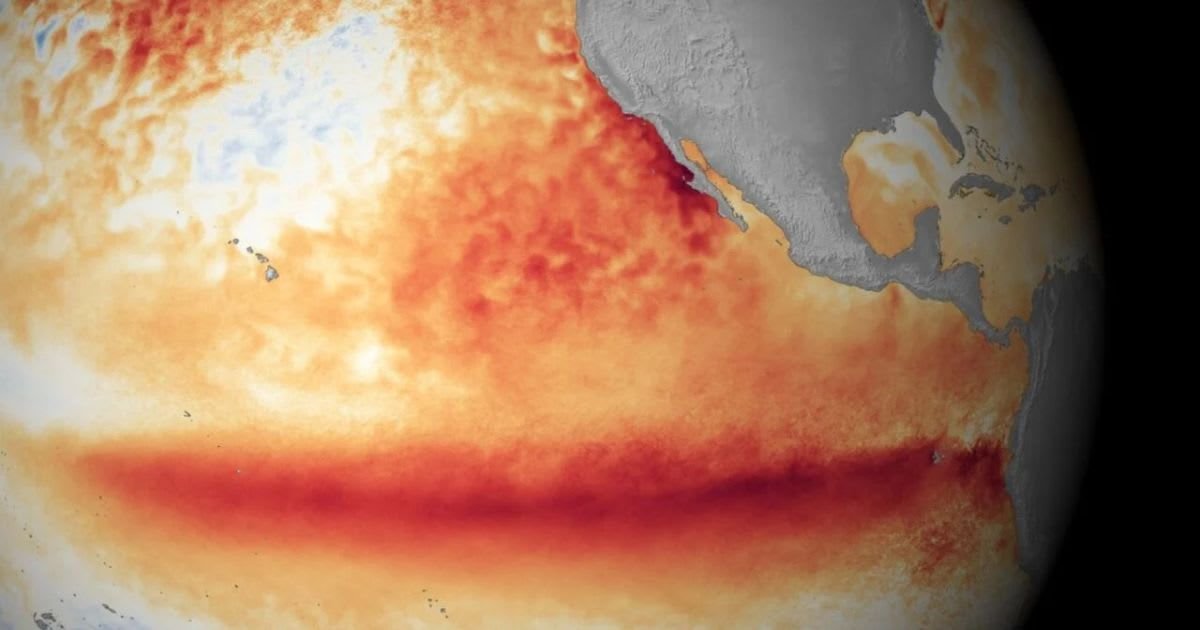
Je vais employer un mot fort : alarmant. Vous pouvez me le reprocher (ou m'insulter). Mais je l’assume, car il est justifié. Les prévisions sont alarmantes, oui : nous nous dirigeons vers l’un des (ou le ?) El Niño les plus puissants jamais observés depuis le début des mesures.
Comment je justifie l'emploi de ce terme "alarmant" ?
➡️Parce qu’El Niño agit comme un accélérateur ponctuel de chaleur à l’échelle mondiale.
➡️En plus de cela, de nombreux travaux montrent une accélération du réchauffement climatique (depuis 2015).
➡️Et depuis le précédent El-Nino, les températures mondiales semblent décrocher des trajectoires habituelles.
On voit sur la carte que, dans la zone clé du Pacifique équatorial (domaine de El-Nino), les anomalies de température de surface de la mer pourraient atteindre +2,5 à +3°C en moyenne.
Autrement dit. Comme ça c'est clair : on ajoute une couche de chaleur exceptionnelle sur un climat déjà fortement réchauffé qui ne s'est pas encore remis du dernier El-Nino.
Il est donc très probable que les records mondiaux (déjà pulvérisés il y a à peine deux ans) soient de nouveau battus, et largement, dès cette année... Je crois que, pour la plupart, vous ne vous rendez pas compte des conséquences et notamment agricoles, dans un contexte géopolitique extrêmement tendu.
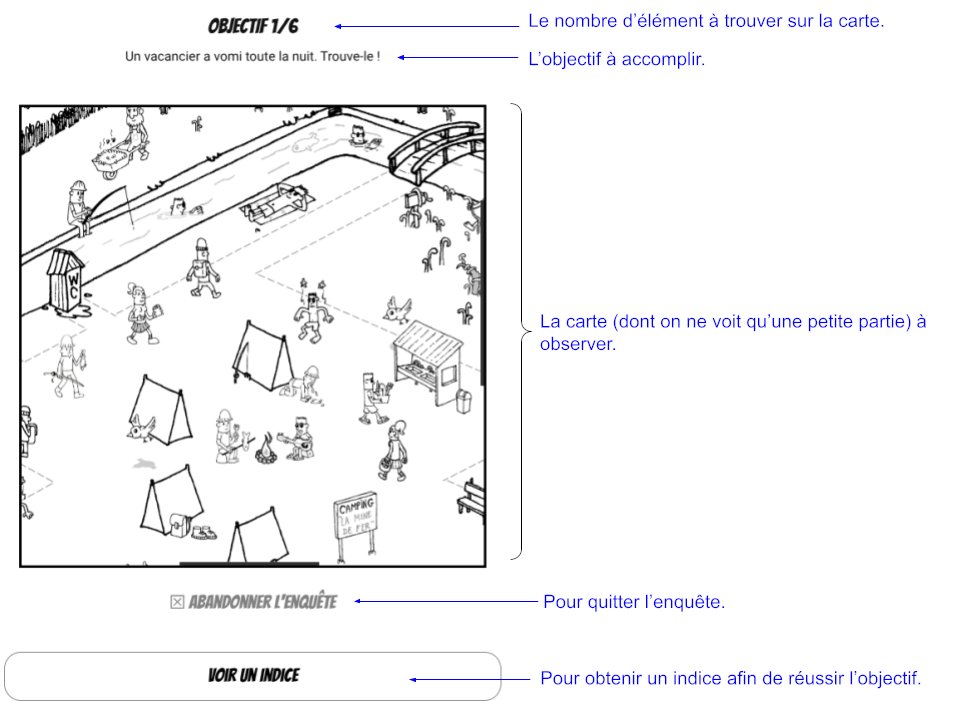
🔍 Nature à la loupe : un jeu sérieux pour comprendre les #écosystèmes
4 enquêtes ludiques en immersion dans une grande carte interactive :
🌍 Concept #OneHealth
📱 Application web & sans compte
🛡️ Conforme RGPD
📜Une ressource présentée dans la Lettre ÉduNum #SVT n°40
🌖 Le décollage d'Artemis II est prévu le 1ᵉʳ avril (le 2 avril à 0h24, heure française). Suivez le lancement en direct et découvrez l'équipage, les enjeux de la mission et la cargaison.
➡️ Explications dans notre article👇
https://t.co/oHhPJ9BMJv
Strongest El Niño Ever Predicted To Happen In 2026
Scientists warn a possible “super El Niño” could form this year, bringing hotter temperatures and extreme weather worldwide
Could make wildfire seasons worse in places like California and Oregon
https://t.co/LCMUo2LEk4
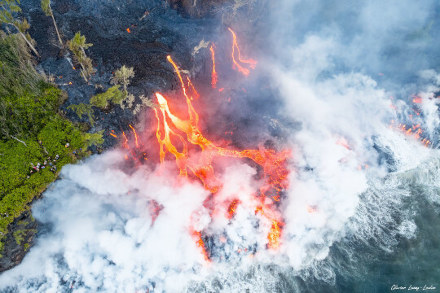
L'éruption de février-mars 2026 du Piton de la Fournaise (Ile de La Réunion) : quand la lave atteint l'océan après avoir traversé la forêt
– par Pierre Thomas, Olivier Lucas-Leclin, Nathalie Lauret, Élisabeth Salaun #géologie#teamSVT
https://t.co/1iGuVKlAzj