Hi, I'm Edu. I write about investing, markets and personal finance from a European perspective.
Clear explanations, useful charts and long-term thinking.
Educational content, not personalised investment advice.
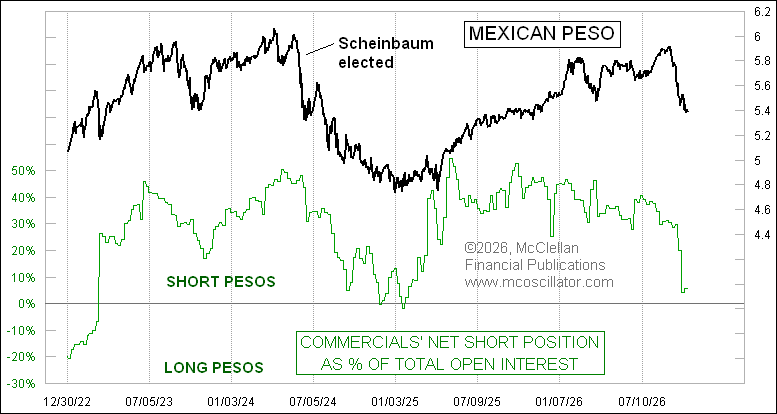
[2/2] 💡 The chart plots the peso against those traders’ net position. It describes the data, not a forecast.
Chart: McClellan Financial Publications.
Source: @McClellanOsc
Educational content, not personalised investment advice.
[1/2] 🔴 The Mexican peso is down 9.1% from its 4 September peak.
📉 Large “commercial” traders were heavily short pesos that day. They have since unwound those positions as the peso fell.
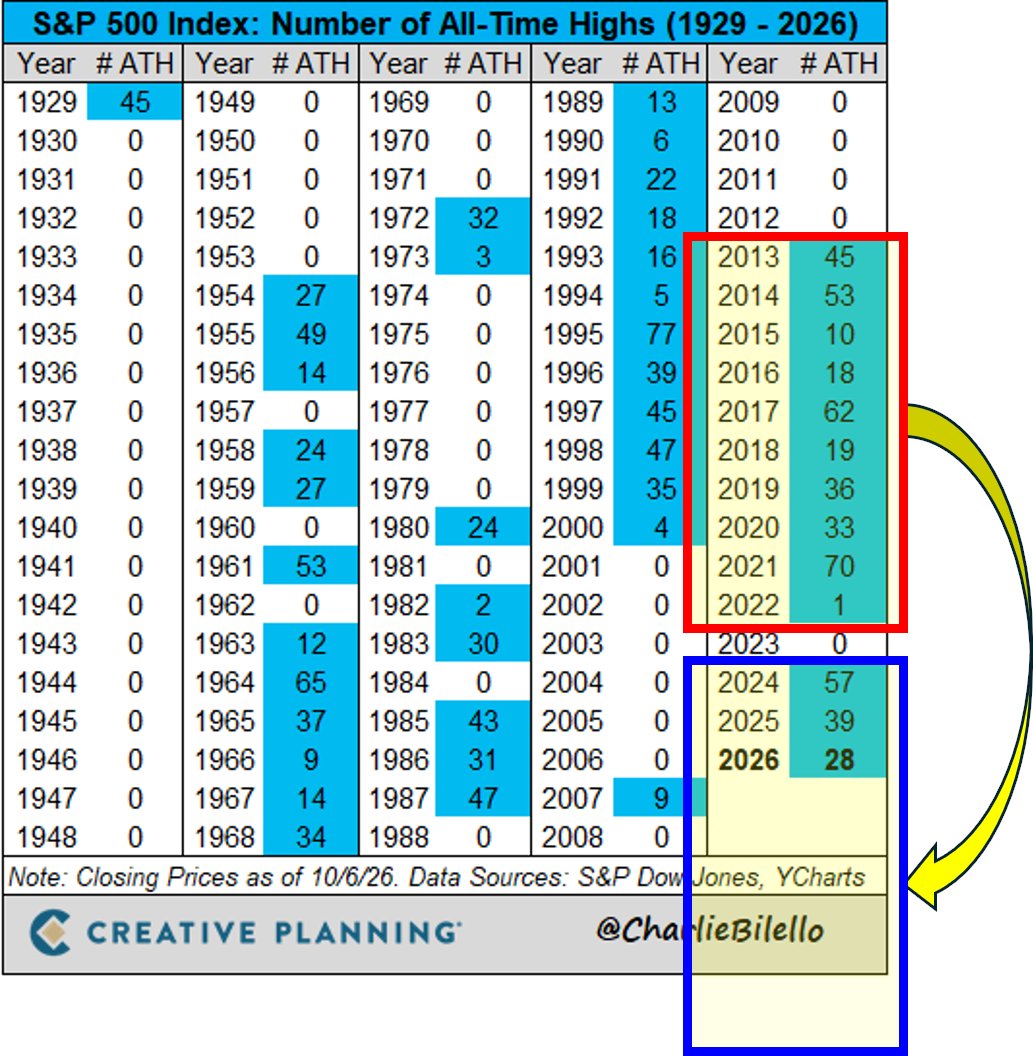
[2/2] 💡 Record highs tend to cluster: dozens in some years, none in others. This describes a pattern; it cannot tell us how many 2026 will end with.
Source: @BlakeMillardCFA
Educational content, not personalised investment advice.
[2/2] 💡 Money flows, not a price forecast. 3x leveraged funds amplify both gains and losses.
Do you gauge sector sentiment by flows or prices?
Source: @Bluekurtic
Educational content, not personalised investment advice.
[1/2] 🔥 The 3x leveraged semiconductor ETF $SOXL posts its largest weekly inflow on record: $6.1 billion.
📊 Friday alone brought $2.3 billion, the largest daily inflow on record.
@MorningstarInc@christine_benz Higher yields don't change what each bucket is for: cash and short bonds fund spending in the next few years, stocks fund the decades after. The real trade-off is reinvestment risk. Cash yields reset lower when rates fall; a longer bond locks the yield in. What is the goal?
[2/2] 💡 The map shows technology falling and defensives rising. This is weekly performance, not a trend.
Source: @WOLF_Financial
Educational content, not personalised investment advice.
[2/2] 💼 A larger economic share than any major investment boom in 200 years. AI is an estimate (2025–32).
A new era or excess?
Source: @BlakeMillardCFA
Educational content, not personalised investment advice.
[1/2] 🔥 AI infrastructure spending is projected to average 3.6% of US GDP in coming years.
📊 Canals 0.66% | Railroads 2.24% | Electrification 0.5% | Highways 1.13% | Telecom 1.1% | AI 3.63%
Chart: Stijn van Nieuwerburgh.
[2/2] 💡 A spread is the extra yield demanded for lending to the weakest borrowers. A rise signals greater perceived risk in that debt.
Do you watch credit before stocks?
Source: @ConnorJBates_
Educational content, not personalised investment advice.
[2/2] ⚡ The ratio is back at its average (0.12). This describes relative positioning; it does not predict future performance.
Source: @ConnorJBates_
Educational content, not personalised investment advice.
[1/2] 🔴 AI beneficiaries are down 24.87% versus the rest of the market from their peak.
📉 GSTMTAIP / SPXXAI: high of 0.15 on 22 June 2026, average 0.12, low of 0.10 on 17 December 2025.
Goldman Sachs trading desk.
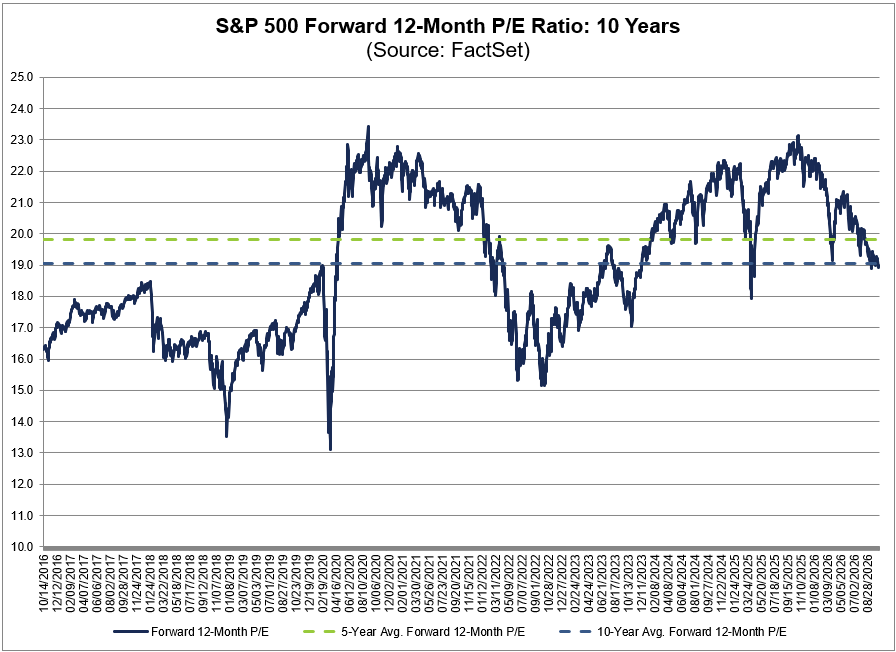
[2/2] 💡 Each dollar of expected earnings costs slightly less today than the average in recent years. This describes valuations; it does not predict the future.
Source: @FactSet
Educational content, not personalised investment advice.
[1/2] 🟢 The S&P 500 forward P/E is 19.0 (expected earnings over the next 12 months).
📊 Below both its 5-year average (19.8) and its 10-year average (19.1).
[2/2] 💡 When rates rise, existing bonds fall in price. Which of these maturities do you follow?
Chart: Bloomberg.
Source: @GlobalMktObserv
Educational content, not personalised investment advice.
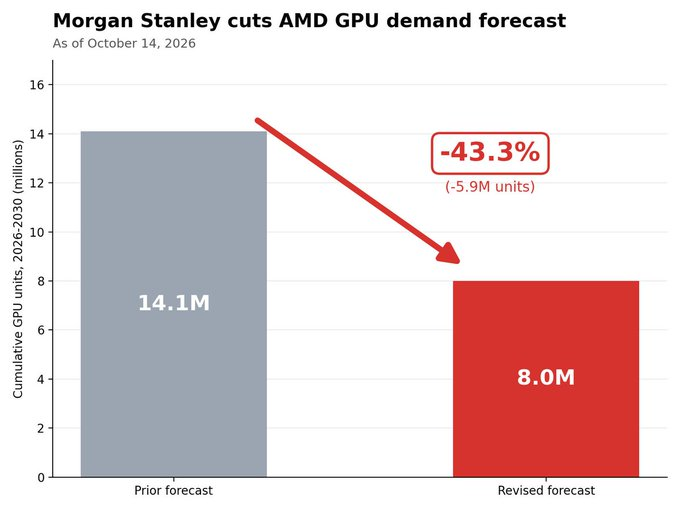
[2/2] 💡 A bank estimate, not sales data: it could change again.
Do you trust the forecast from months ago or this week’s more?
Source: @Mayhem4Markets
Educational content, not personalised investment advice.
[1/2] 🔴 Morgan Stanley cuts its $AMD GPU demand forecast by 43.3%.
📊 From 14.1 to 8.0 million cumulative units over 2026–2030 (-5.9 million). Revised 14 October 2026. Chart: Morgan Stanley.