Look at the green circle on the chart.
The heaviest volume of the entire multi-year run is arriving now, at the steepest part.
This is the part most people get backwards.
They think the surge of volume is confirmation — buy the strength.
But at the end of a parabola, that volume is not the smart money arriving. It is the last money arriving. It is the dentist and the firefighter and the taxi driver finally deciding the thing is safe — precisely because it has gone up so much that it now feels safe. The institutions who accumulated quietly, stages ago, are the ones selling into that euphoria.
Here is the statistic that should stop every holder cold.
O’Neil’s research on the biggest winners in market history found that stocks which top in a genuine climax run typically do not make a new high again for ten to twenty years — if ever.
The climax is not a pause.
For the great majority, it is the high-water mark of a generation. That is why the discipline is to sell into the strength, not wait for the breakdown: by the time the breakdown is obvious, the decade-long wait has already begun.
*Hormuz Vessel Crossing Update, Back down to 24
The pullback to 24 reflects renewed escalation: the U.S. conducted fresh strikes on Iranian targets around the Strait of Hormuz on Saturday in response to a drone attack on the tanker M/T Kiku, days after an Iranian drone struck the container ship Ever Lovely — the first vessel hit since the U.S.–Iran ceasefire was signed.
The back-and-forth is straining the agreement's plan to restore normal marine traffic, with CENTCOM noting commercial vessels are still transiting but well below pre-crisis levels.
Powered by our commercial vessel crossing index, using AIS data refreshed every 30 minutes.
My analysis of the Strait of Hormuz over the last 24 hours.
If the tankers use the Iran route, they are dominantly Iran-related. If the tankers use the Oman route, they are not, and never sanctioned.
I have heard from ship owners that most tankers cannot use the Iran route because the EU has not lifted sanctions on IRGC. Using the Iran route would risk sanctions, making the Oman route the only viable option.
With more conflict going on between IRGC and the US, the visible AIS data on Oman's tanker route is going to go dark again, which means Iran will have to keep escalating in order to completely halt flows.
For the US, the fact that the Oman route might be blocked presents it with a big ultimatum: either the US escalates or gives IRGC control of the Strait of Hormuz. Logic says there's no way that would happen, so escalation will continue.
Given that Trump has made it obvious that he does not want to escalate, I fear that the IRGC would just keep escalating until they gain control.
This issue is far from over.
I have included the video from @MarineTraffic and my table for inbound tankers.
SPX:GDP (Quarterly): Buffet's favorite macro indicator, the SPX:GDP ratio just hit its measured-move target - The last 5 times this happened since GDP began being reported in 1947, each time decline in SPX followed by imminent declines, ranging from 15-49%. Above here goes to Oz
6/27/26 SPX:M2 (1958-2026): The SPX:M2 ratio just tagged its 161.8 fib measured-move target again for a double-top (1st hit in Y2k). See '08 for the last convergence(!), but this is the first time all 3 are converging at the ratio's 161.8 target at the same time. Interesting, no?
Despite trading lower every day this week, breadth on the S&P 500 has been positive for six straight days (longest streak since last July), and the S&P 500 cumulative A/D line hit a new high.
The market's rally is broadening:
The S&P 500 equal-weight ETF, $RSP, has outperformed the S&P 500 ETF, $SPY, by +5.0 percentage points so far in June, on track for its best monthly outperformance since 2009.
That would also mark $RSP's 2nd-best month relative to $SPY in at least 23 years.
This comes as $RSP is up +1.9% month-to-date while $SPY is down -3.1% over the same period.
This week alone, the equal-weight ETF, $RSP, outperformed the S&P 500 ETF, $SPY, by +3.4 percentage points, the largest weekly outperformance since the 2020 pandemic.
As a result, the 52-week correlation between the S&P 500 and the S&P 500 equal-weighted index is down to 0.90, from 0.97 in 2022, the lowest since 2003.
Mega-cap tech leadership is taking a breather.
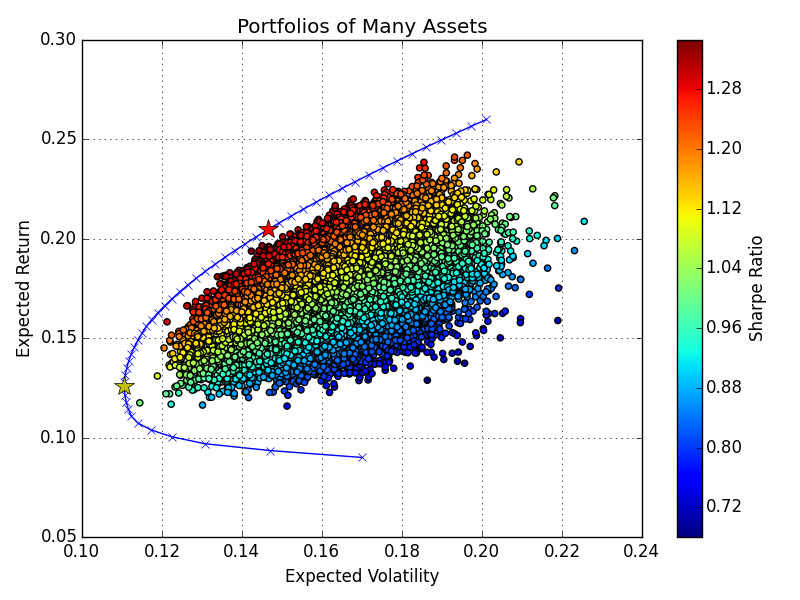
There's a curve in finance that most investors get wrong.
It's called the efficient frontier.
Markowitz defined it in 1952.
Most investors still don't understand what it means in practice.
Here's what they get wrong:
#EURUSD 🇪🇺/🇺🇸 Current wave analysis of the pair on the monthly timeframe
Is it time for a deep correction?🤔
- One possible scenario is an uptrend that has formed in a leading diagonal pattern.
- The price may now move higher to complete the fifth wave of this pattern through a corrective wave. If a reversal occurs from the upper boundary of this pattern, we can expect the following:
- A sharp decline within the sub-waves of wave (2)/(B).
- The target levels for the decline are shown on the chart.
- If the price reverses from this area, we may see a subsequent rally.
- ⚠️ A break below the 0.95360 level opens the door to a deeper decline, so caution is advised if it is broken.
...To analyze our educational program 👉:
https://t.co/CRUph7e5PO
#EURUSD #ElliottWaves #PriceActionTrading #PriceAction #PriceActionStrategy #CurrencyTrading #TechnicalAnalysis #TradingForLives #TradingAcademy #TradingStrategies #TradingProfits #TradingExpert #TradingForLives #ForexSchool #ForexAsia #ForexDubai #ForexEurope #ForexUK #ForexMalaysia #ForexAustralia #ForexSpain #ForexFrance #ForexJapan #ElliottWaves #WaveAnalysis #GoldTrading #PriceActionTrading #XAUUSD #DowJones #ForexUK
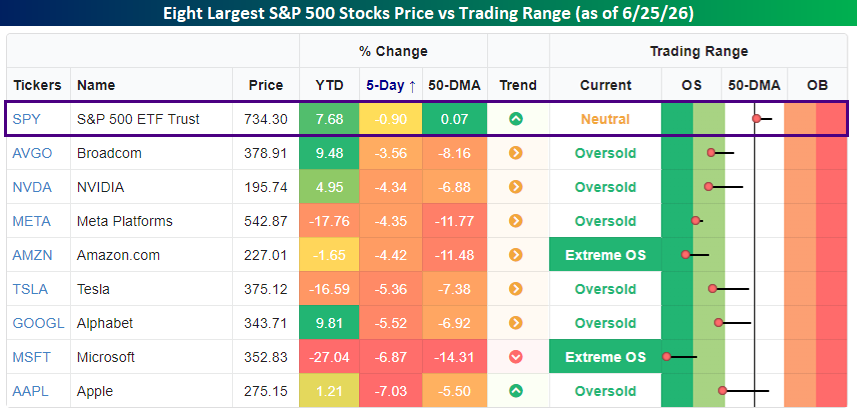
The 8 largest S&P 500 stocks are all down at least 8% this month for an average decline of 13.7%.
$NVDA $GOOGL $AAPL $MSFT $AMZN $AVGO $TSLA $META
The next 9 largest are all up this month for an average gain of 7.6%. 🤔
Three Things that stand out:
1. Nominals are compressing lower (curve flattening)
2. Reals are compressing higher (restrictive)
3. Breakeven curve uninverted again but declining (risk in reals not nominals)
Implies to me if continues:
1. Long end most constructive for now
2. Real assets like gold and stocks stay pressured
3. Market will start trading for recession
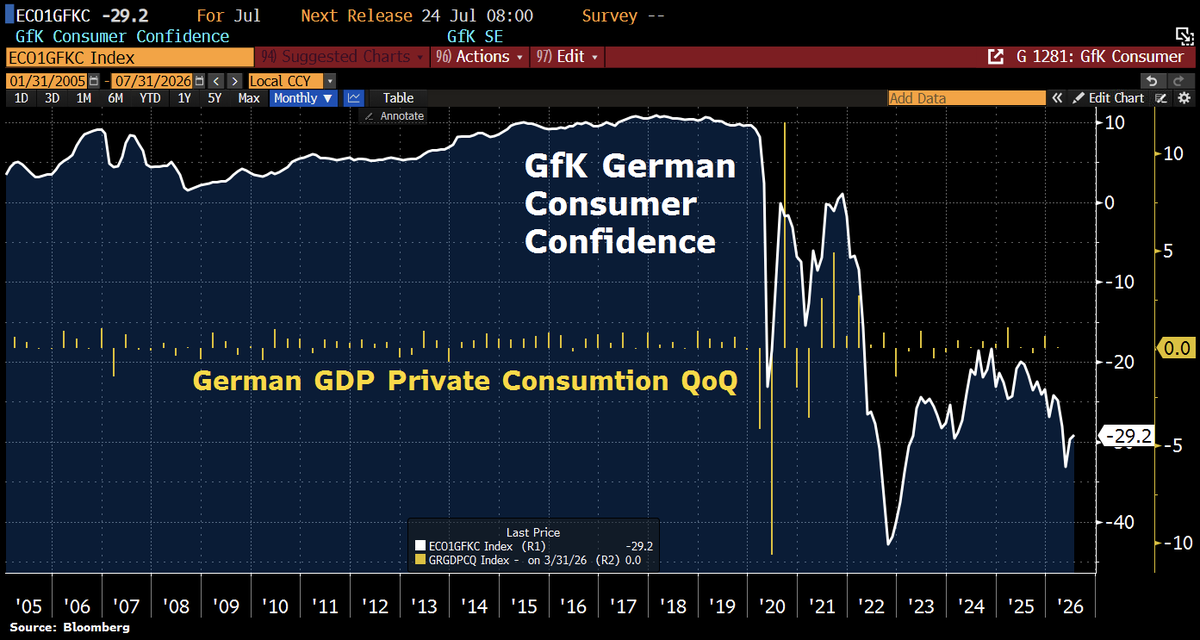
Good Morning from Germany, where consumer confidence remains stuck near crisis levels. GfK Consumer Sentiment for July edged up only slightly to -29.2 from -29.7, still far below pre-Covid levels. Income expectations improved a bit, but buying appetite stays weak and savings intentions high; bad news for Germany’s private consumption engine.