UPDATE: The current 2025 Bitcoin Cycle has finally gone above the 2017 Cycle, with respect to the Bitcoin Power Law—this is good news since the current Bitcoin Cycle has been below all previous Cycles for the last two months.
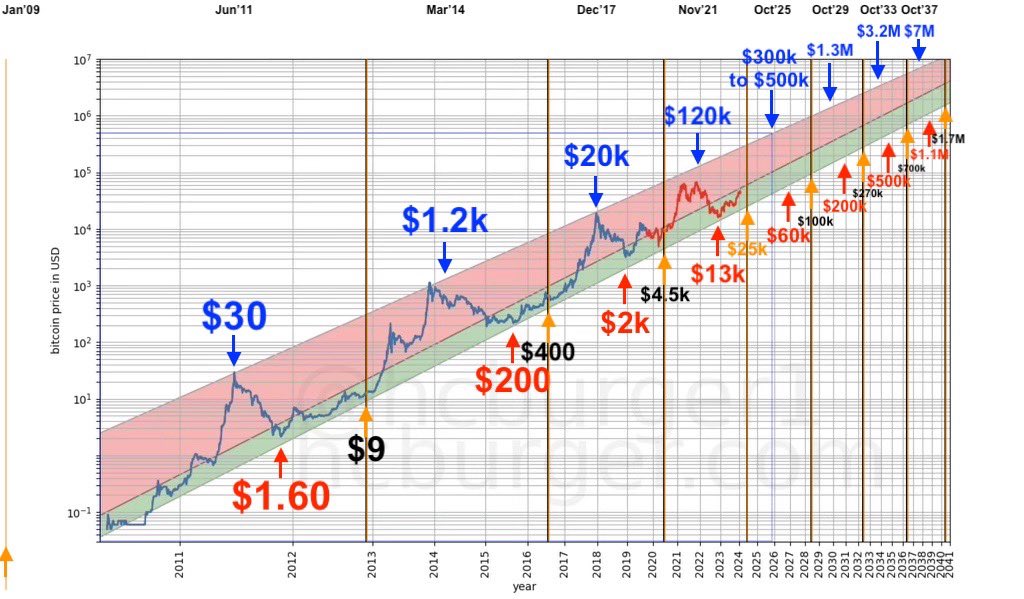
This Bitcoin chart is a combination of two concepts around Bitcoin.
Previous Bitcoin Cycles are aligned and overlayed onto current 2024-2025 Bitcoin Cycle based on:
1. HORIZONTAL - TIME (X-AXIS): Bitcoin ₿lock Time Chain and Spiral Clock ₿lock Time.
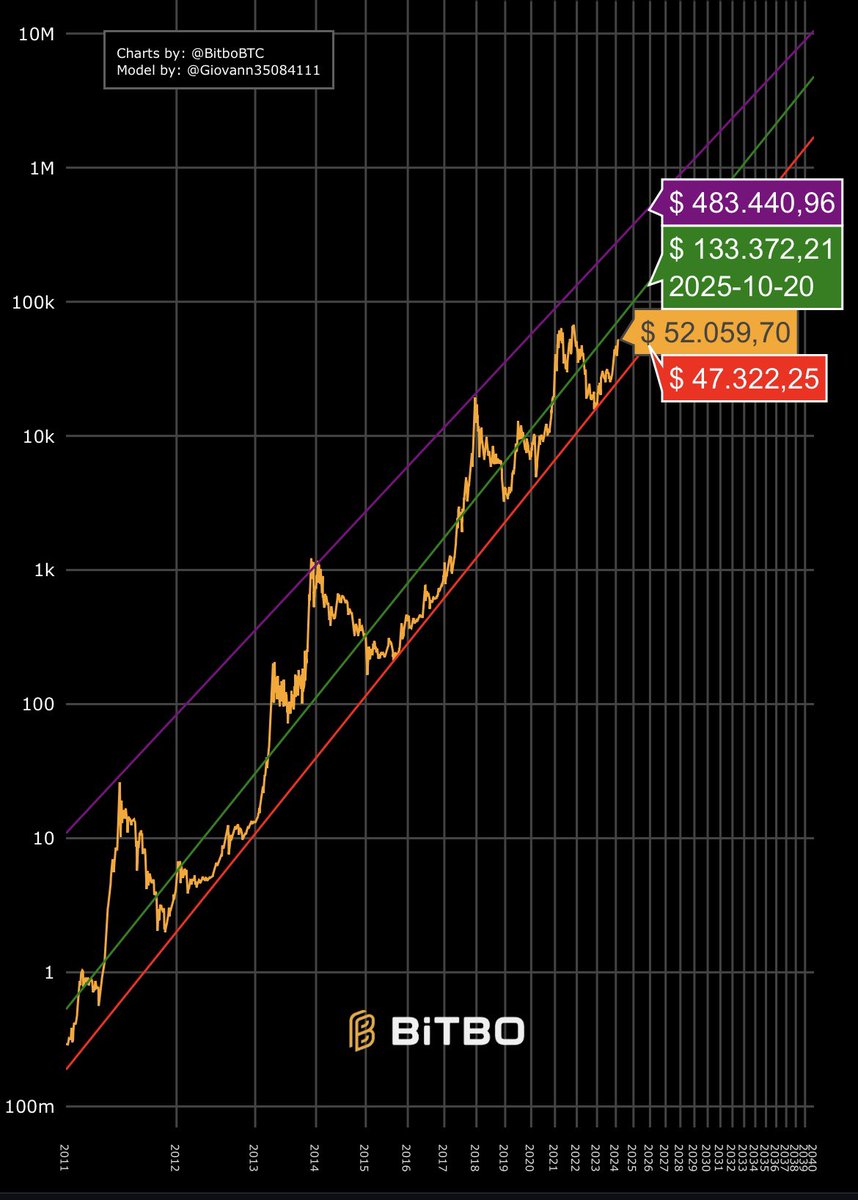
2. VERTICAL - PRICE (Y-AXIS): Bitcoin Power Law bands that it hit during previous cycles:
• Lower floor support (red line)
• Regression fit (green line)
• Top resistance (purple line)
On the eve of the 2020 bullrun, 22k ₿itcoin Blocks after the Halving, on 10/12/2020, this video was being forwarded around.
Today, we are on the eve of the beginning of the 2024 bullrun, also now at 22k ₿itcoin Blocks after the Halving.
The #Bitcoin Power Law chart shows the next all time high to be between $133k and $483k.
(But how did I come up with mid Oct., 2025? Well, the #Bitcoin Spiral Clock shows 4:30 to be about there and the original #Bitcoin Stock-to-Flow shows the top of the ramp to be about there as well.)
I need to write a Medium article on the history of the Power Law model. But basically it goes like that
1) 2013-14 G. Santostasi @Giovann35084111 points out Power Laws in the addresses and transactions of BTC.
https://t.co/QMwFUNGOsE
2) 2014 Trololo does a non-linear fit to BTC price and comes up with a non super clear model log10 on the y axis and loge behavior for BTC as a function of time from the non linear regression. It was the grand-father of the power law but he didn't recognize it as such.
https://t.co/5ILc0MgBTU
3) 2018 G. Santostasi writes his Reddit post on BTC being a power law in time. https://t.co/rPzaCFeU7n
4) 2019 @hcburger1 quotes Giovanni's work and elaborate on it.
https://t.co/KkyJOrKmwn
5) 2020 Bitbo makes an online chart based on other's people work.