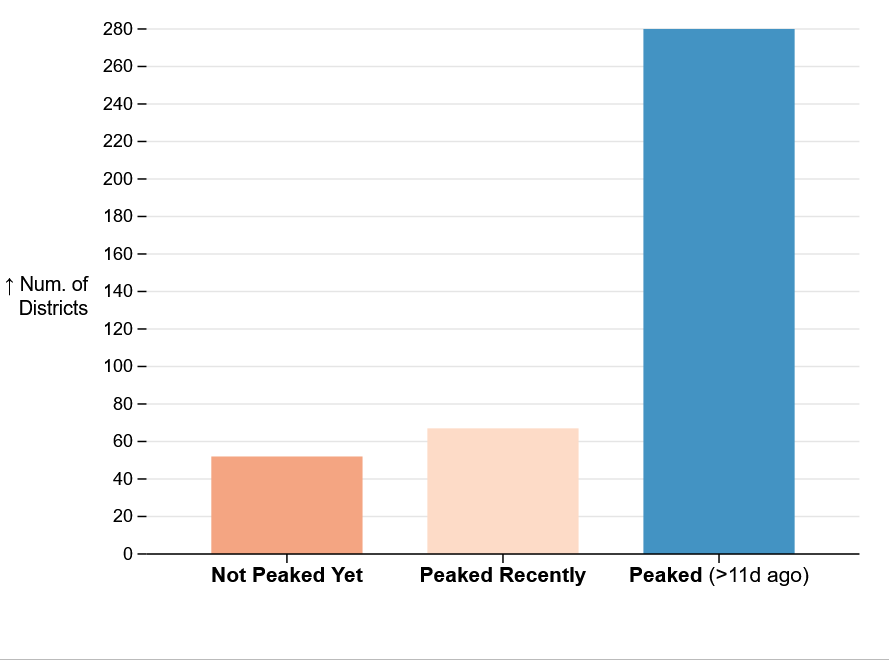
🧵on 3rd/2nd wave peak ratio across districts 👆
@nvcmenon@Teensthack
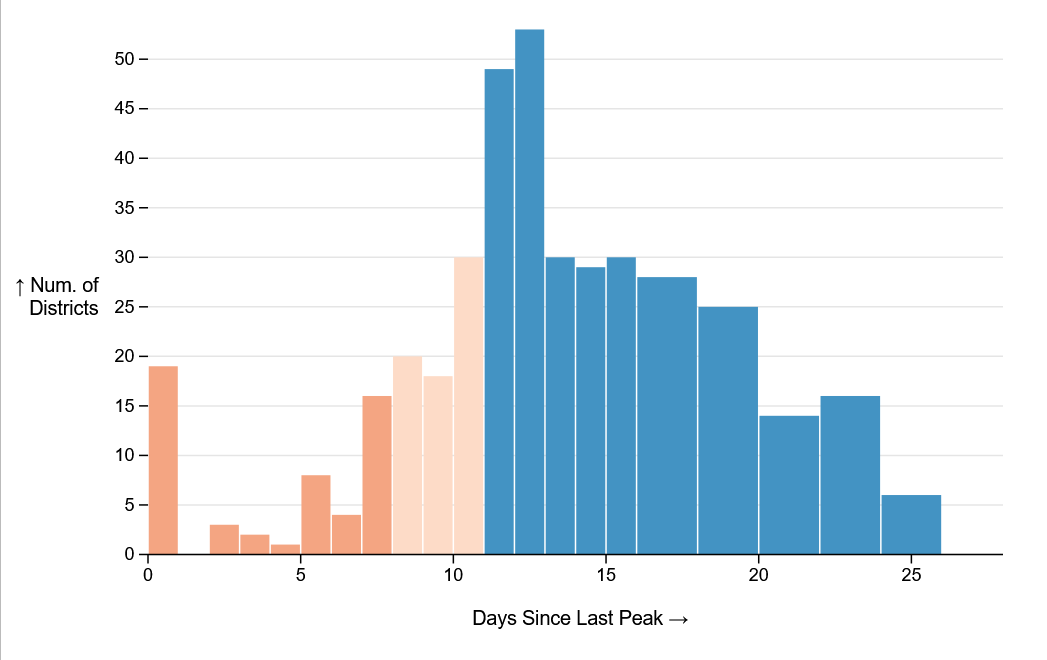
See also loose criteria for peaked >11d ago, and status:
https://t.co/vam1DGCC9r
174 districts in 🇮🇳 have peaked LOWER than 2nd wave.
Most peaked at 40-60% previous peak. See distribution
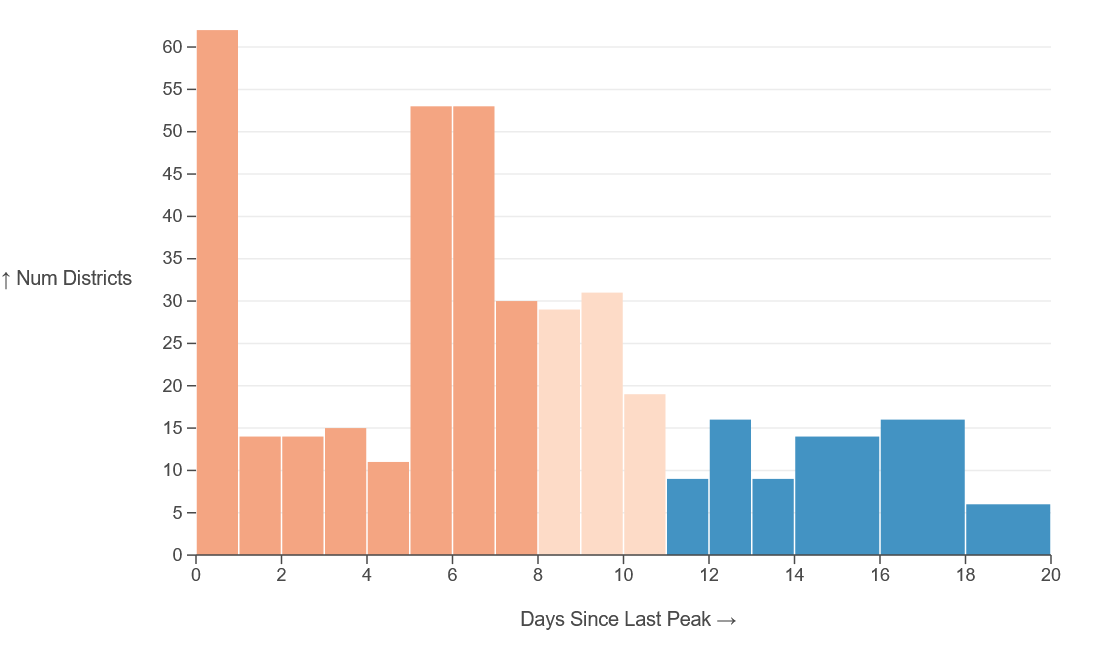
Light colors: yet to peak; can move →
*3 dists. above 3x:: very small 2nd wave: daily cases <50; 3rd wave<150. peak↑ but inaccurate ratio
#omicron
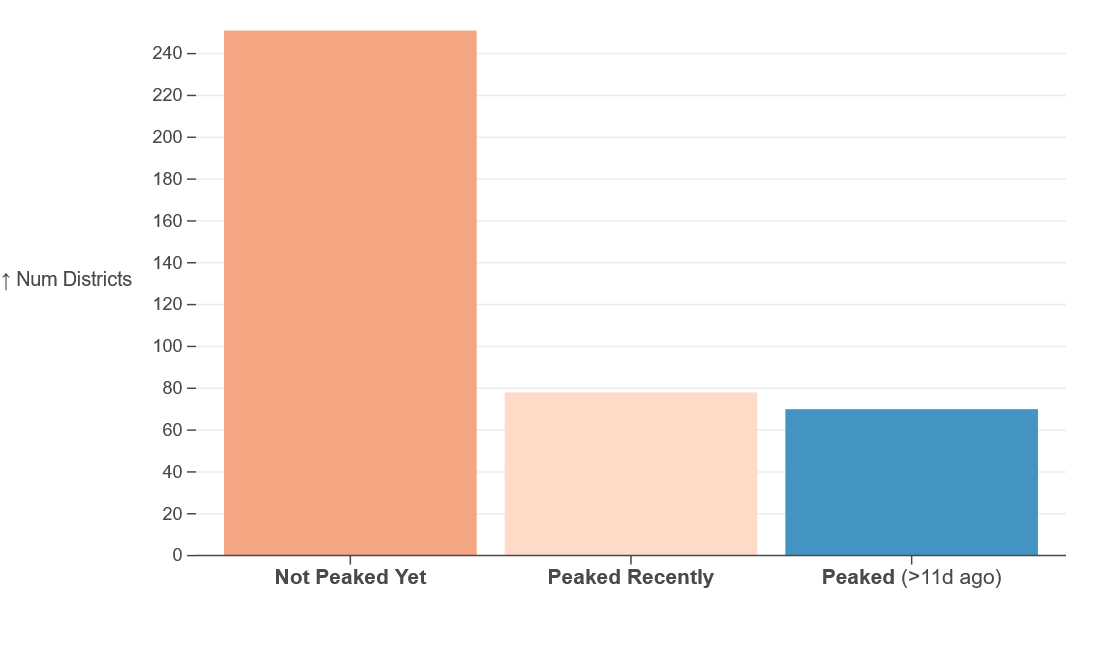
3rd Wave Progress by Districts:
Although big/early cities have already peaked, no. of districts yet to peak: 251(~63%)
The end phase for everyone will begin as dists. move right in the chart.
(2) zoomed in by day
For 400 dists with
- discernible surge
- dist. data (eg, no TG)
#Omicron 3rd Wave in India, week 4:
As on Jan 25:
🔷1w Rt ↓ in all states. Most <1.50, quite a few <1, Post-peak DL,WB BR,JH <0.5
🔶High Cases and ↑ Rt: KL .. KA,TN .. AP,MP .. RJ,GJ
🟡 TPR(1w) ↑ where cases ↑: KL(~44%❗),AP(30),NE,KA(22); ↓ in post peak DL,WB
It is great that there are clearly post peak states already. See many early districts which are post peak (indicative of nearing overall peak) 👇
@nvcmenon
https://t.co/2IrFdpXWIX
Many of the earliest hit cities have moved on 1-2 weeks past peak.
Sorted by Days since Peak(see gray chart). Last 3 TBD
It is fantastic to see the rapid decline.
Overall peak expected later this week/next week, but this presents a very reassuring forecast of the near future.
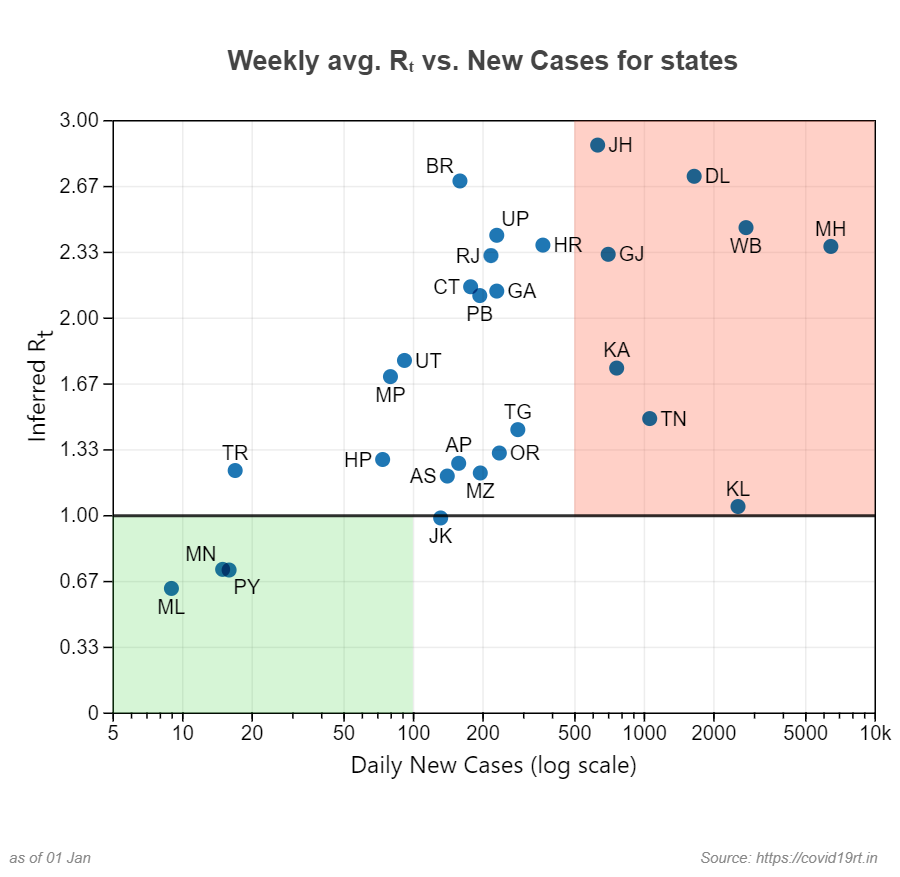
Weekly #OmicronUpdate for Covid 19 third wave in India, week 1:
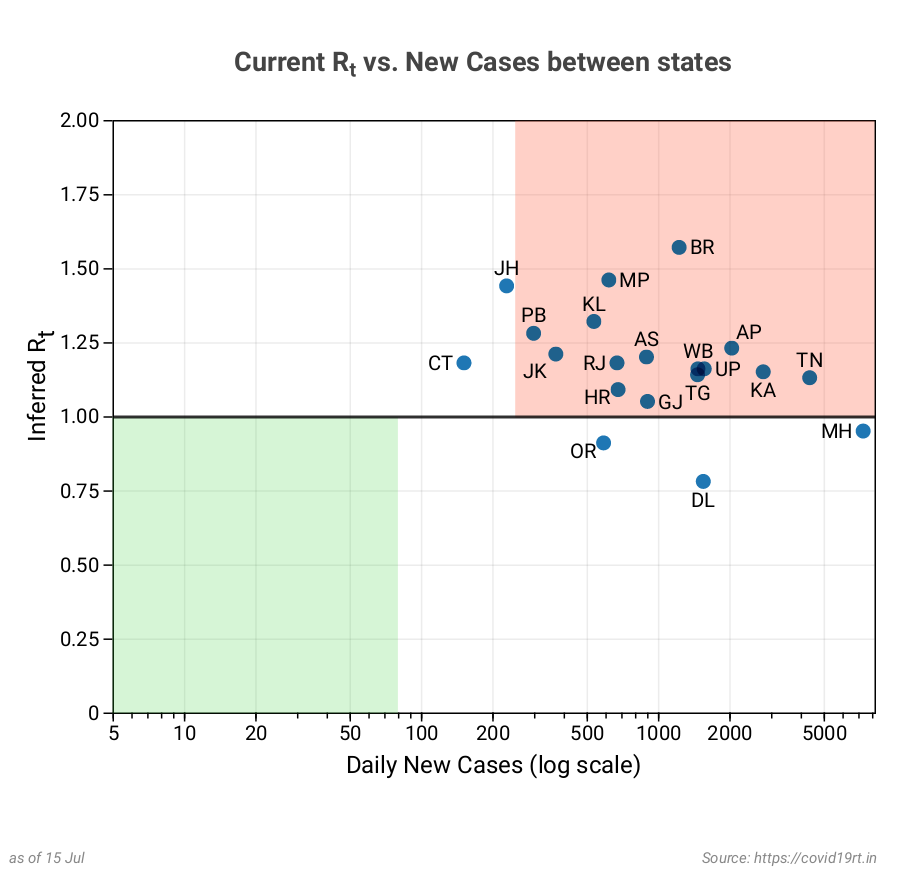
The avg. daily cases and 1 week avg. growth rate across states as on Jan 01 (Together they give an idea of the amount of risk)
More at: https://t.co/UST3uvZMFn
#Omicron 3rd Wave in India, week 4:
As on Jan 25:
🔷1w Rt ↓ in all states. Most <1.50, quite a few <1, Post-peak DL,WB BR,JH <0.5
🔶High Cases and ↑ Rt: KL .. KA,TN .. AP,MP .. RJ,GJ
🟡 TPR(1w) ↑ where cases ↑: KL(~44%❗),AP(30),NE,KA(22); ↓ in post peak DL,WB
Many of the earliest hit cities have moved on 1-2 weeks past peak.
Sorted by Days since Peak(see gray chart). Last 3 TBD
It is fantastic to see the rapid decline.
Overall peak expected later this week/next week, but this presents a very reassuring forecast of the near future.
#OmicronUpdate Covid 3rd Wave in India, week 3:
As on Jan 17
1) B'luru ~most affected city
2) Rts have settled lower, but TPRs ↑
- DL/WB (high cases and Rt↓) have ~30%, Mum ~20%
🔸High Cases AND Growth Rate:
- KA, KL lead. Then TN, UP, OR
More at: https://t.co/RVhEsu5FLp
#OmicronUpdate Covid Third Wave in India, week 2:
Jan 09: avg. new cases, growth rate and 1w avg. TPR across states and most affected districts
More at: https://t.co/RVhEstNwxh
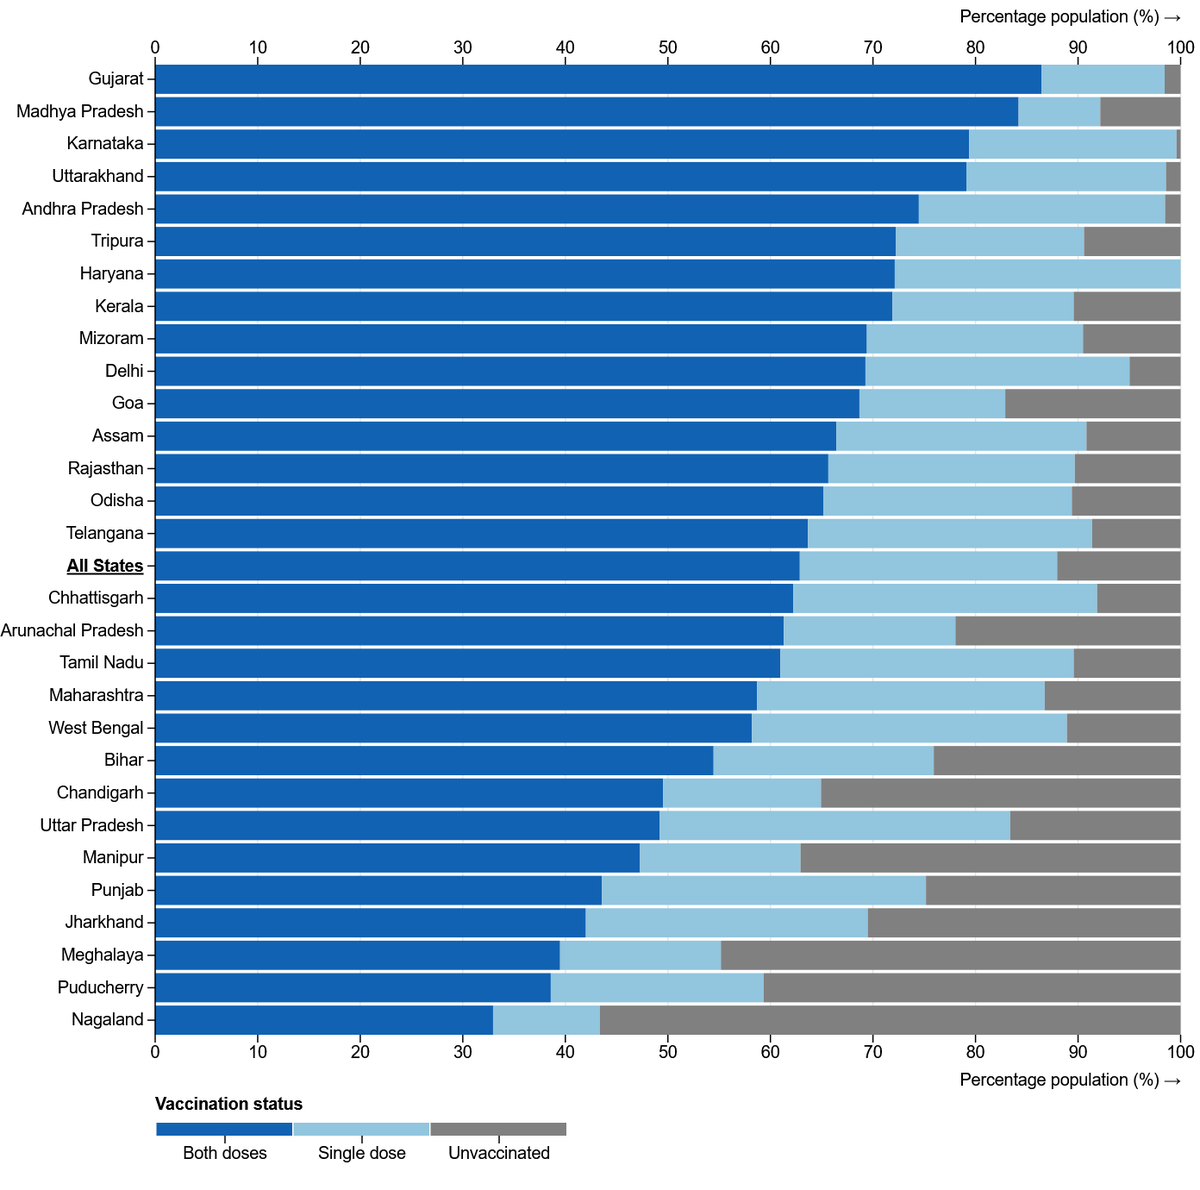
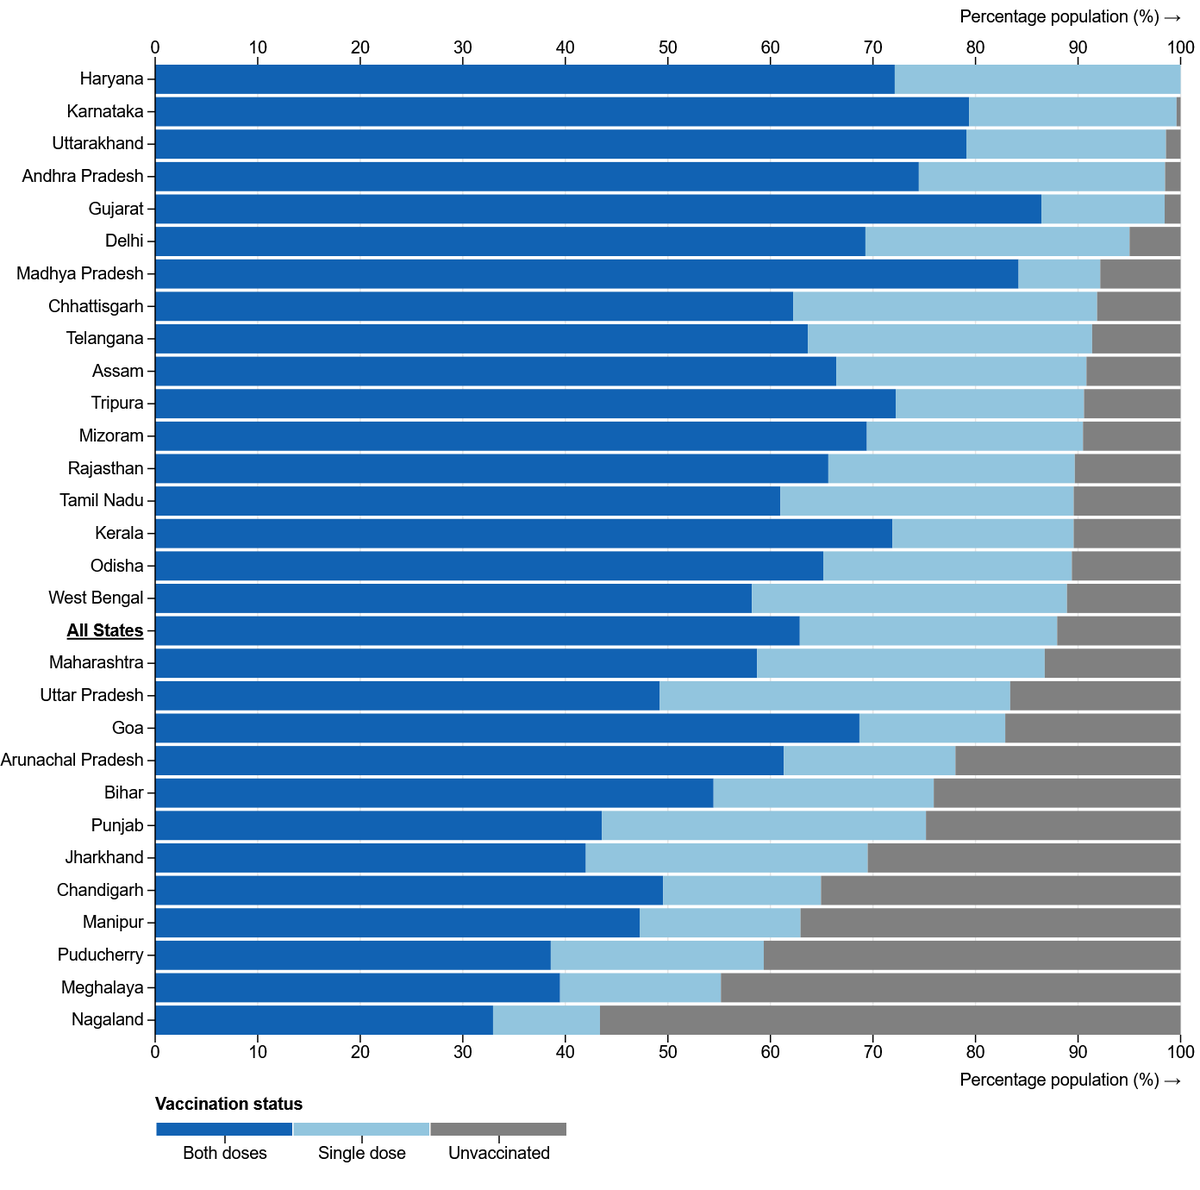
Vaccination coverage in India as on Jan 11
sorted by 1) Both Doses 2) At least one dose
eligible age >= 15; 3rd dose not shown
pop. <5L not shown
JK,HP,SK have 1) > 95% and 2) > 100%; not shown
sources/caveats 👇
Doses count from CoWIN
Target pop. as per affidavit in SC...
..(AP, TG from last ECI report)
-Target population is estimated from Census 2011. There may be some error but these are official nos.
-Impossible to correctly quantify eligible pop. per state factoring changing migration pattern especially during pandemic. Expect few % points err
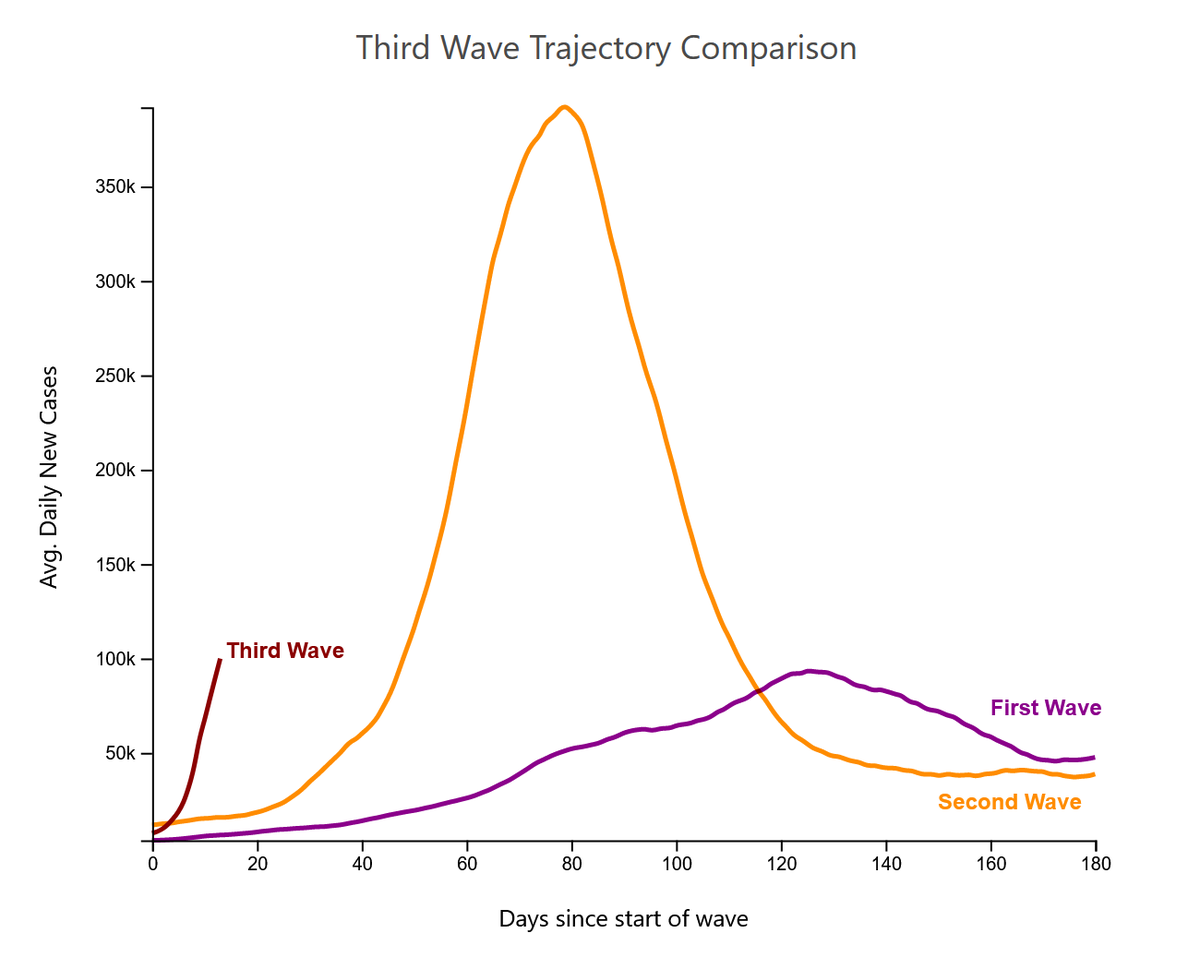
India #Omicron Covid evolving third Wave trajectory comparison
Here we can see how much the peak of 2nd wave was higher than the 1st and how it resolved sooner. The curve for wave 2 is both taller and slimmer (hence left shifted), i.e. rising and falling faster than 1st wave.