Weekly Gold Market Outlook (July 20–26, 2026) The gold market enters a critical consolidation phase, testing the crucial $4,000 psychological threshold. The asset has pulled back from its January record high due to hawkish Federal Reserve expectations and a strong US Dollar, persistent central bank buying—led by the People’s Bank of China—continues to provide a solid long-term floor.
For the upcoming week,Our analysts predict an extended consolidation with gold expected to trade sideways within a parallel channel of $3,950 to $4,060/oz, as investors cautiously await the high-stakes FOMC policy meeting scheduled for late July.
Key macroeconomic events to monitor this week:
• Monday: People's Bank of China (PBOC) interest rate decision
• Thursday: European Central Bank (ECB) rate decision - (USD) Unemployment Claims
• Friday: Manufacturing & Services PMI
#XAUUSD_BUY #XAUUSD #weekly #forexsignal #FXTrading #News
🏆 WORLD CUP 2026 FINAL 🏆
⚽ Argentina vs Spain
💰 Total prize pool: up to 5 $ETH
📋 How to join:
1️⃣ Join our Telegram channel: https://t.co/ALeyrYxXLV
2️⃣ Drop your score prediction in the comments below
🎯 Results based on 90 minutes regulation time only
🎲 Winner(s) randomly selected from correct predictions
Good luck, and may the best prediction win! 🔥
#WorldCup2026 #Argentina #Spain #Crypto #ETH #Giveaway
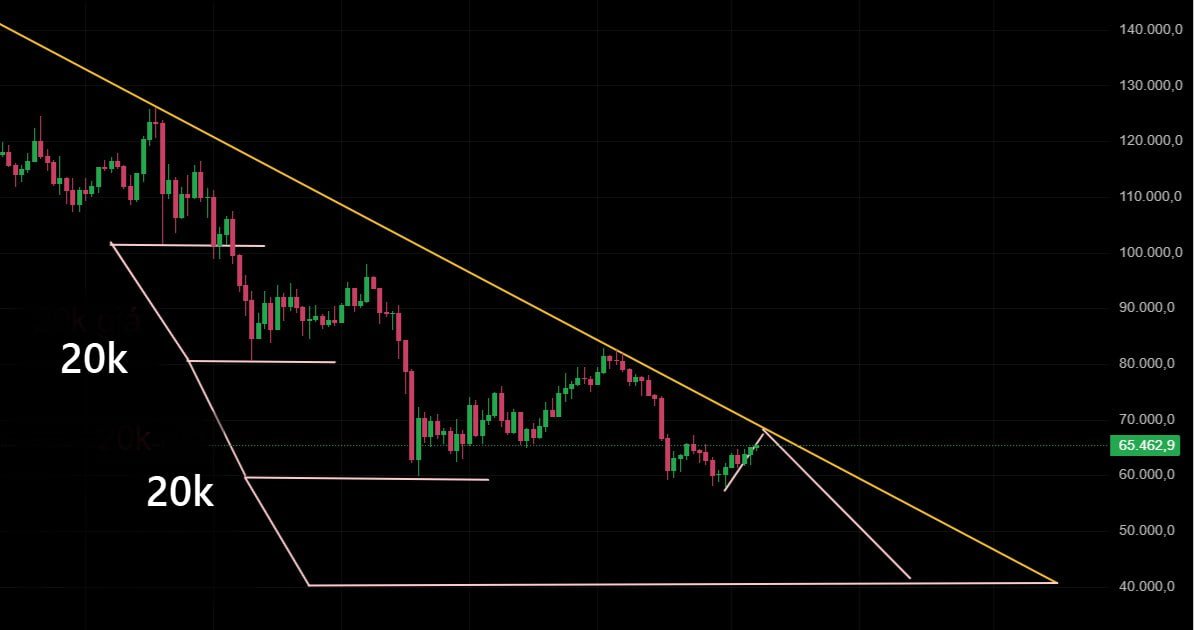
$BTC is grinding higher and eyeing a push straight into major resistance 👀
Currently trading around $64K - $65K, price is forming a small rising wedge that projects a move into the $66K -$67K zone — exactly where the long-term descending trendline (connecting lower highs since the cycle top) meets the upper boundary of the most recent channel leg.
This is a textbook confluence zone. What happens here matters a lot for the next few weeks of price action.
📉 Bearish scenario (primary bias): Rejection at $66K-$67K → continuation of the broader downtrend. Each leg down in this channel has measured close to $20K, so a clean rejection here could open the door to a similar move lower.
📈 Bullish invalidation: A confirmed breakout with a strong close above the trendline flips the entire structure. That would be the first real sign of a mid-term trend reversal after months of lower highs.
$66K -$67K is the zone to watch closely over the coming sessions. No rush to pick a side until price shows its hand at resistance.
Not financial advice. DYOR and manage your risk. 🧠
#Bitcoin #BTC #Crypto #CryptoTwitter #TechnicalAnalysis #BTCUSD #CryptoTrading
@Ventureburn Textbook analysis! 📉 The primary bias makes a lot of sense, especially with that descending trendline acting as heavy resistance. Staying extremely cautious here! 👀🛡️ #TechnicalAnalysis#Crypto#BTC
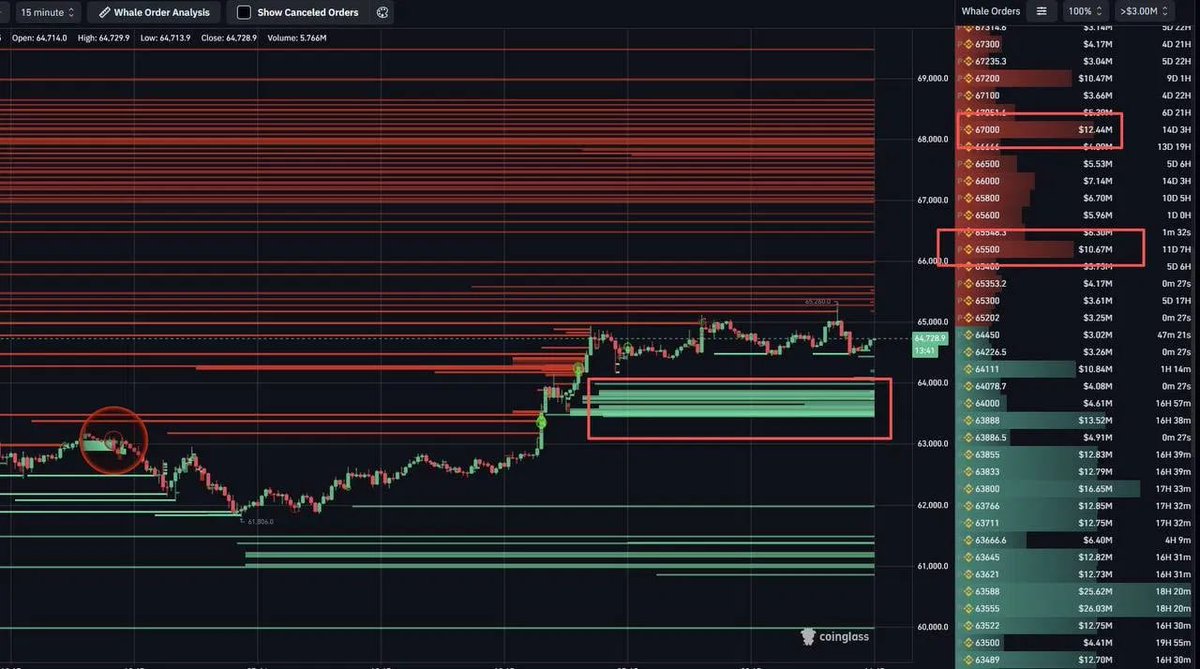
📊 $BTC WHALE ORDERBOOK UPDATE
What's the big money saying right now? Let's break down the orderbook 👇
Resistance to watch:
65.3K – 65.6K: near-term sell zone, likely first reaction area
67K: next major resistance if the near zone breaks
Support to watch:
64K – 64.2K: closest support zone
63.5K – 63.8K: massive buy wall forming — this is the key level
Take:
That huge buy wall at 63.5K–63.8K isn't random — it's likely the launchpad for BTC to defend price and push higher, especially with a thick stack of short liquidity still sitting above, waiting to get hunted 📈
If price retraces to 64K and holds, the setup for a liquidity run toward 65.5K–67K remains the primary scenario short-term.
#MarketResearch #MarketTrends #CryptoLife #Ventureburn #Bitcoin2026 #Blockchain
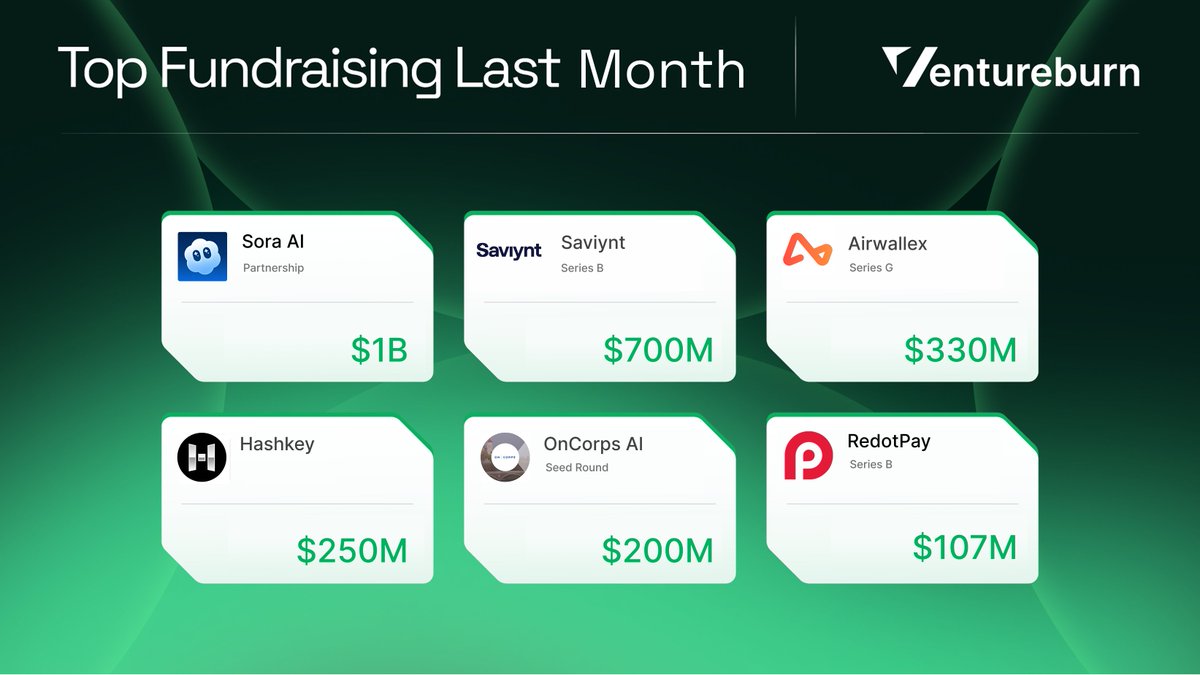
💰 Anthropic just pulled off a historic $6.5B funding round 👀🔥
The AI race is reaching levels nobody imagined...
Read more in the comments ⬇️
This could reshape the future of artificial intelligence 😳
#AI#Anthropic#Startup#TechNews
https://t.co/zikTFGr8ES
🤯 AI growth in 2026 is absolutely INSANE 👀🔥
Some of the latest statistics are way bigger than people expected…
Read more in the comments ⬇️
The AI revolution is accelerating FAST 😳
#AI#ArtificialIntelligence#TechNews#Innovation
https://t.co/CYmfJ1fJC7
🔬Most people only see crypto through charts, but the real story lives in the raw on‑chain data. 🧠
Nansen’s API lets you programmatically access wallet labels, token flows, and smart money movements so you can plug reliable on‑chain intelligence into your own dashboards, scripts, or agents instead of relying on screenshots and vibes. The Nansen CLI brings that same data straight into your terminal, making it easy to run quick checks, investigate wallets, and prototype research workflows without spinning up a full app or UI. Together, API + CLI help you turn on‑chain research into a repeatable process rather than a one‑off manual task. If you’re into researching and want more educational content on using on‑chain data effectively, consider following @nansen_jp for deeper insights. 🔍
Most people in crypto focus on price, but the real edge often comes from understanding on-chain behavior. 🔍
When you track wallet activity, token flows, and smart money movements, you start seeing patterns before they become obvious on the chart. That’s why researchers, analysts, and builders spend so much time on data instead of headlines. The best insights usually come from asking better questions: Who is buying? Which wallets are active? Where is liquidity moving? What trends are building quietly in the background?
If you learn how to read on-chain signals properly, you can make more informed decisions and avoid a lot of noise. It’s not about predicting everything perfectly. It’s about improving your process and seeing what others miss. 📊
Follow @nansen_jp if you are into researching.
#Crypto #OnChainAnalysis #BlockchainData #CryptoTrading #Web3 #Altcoins #Research