In a world where knowledge is power, @getlayerxyz is empowering citizens, governments & businesses with accurate spatial data from 120+ public & private datasets sourced from leading space agencies & commercial providers, enabling teams to work together in shaping our cities.🌐💡
Introducing @getlayerxyz to the readers of #thinkthinkthink. An old aspiration to organize knowledge and data in better understanding and thinking about cities.
https://t.co/aN2m7XsvGB
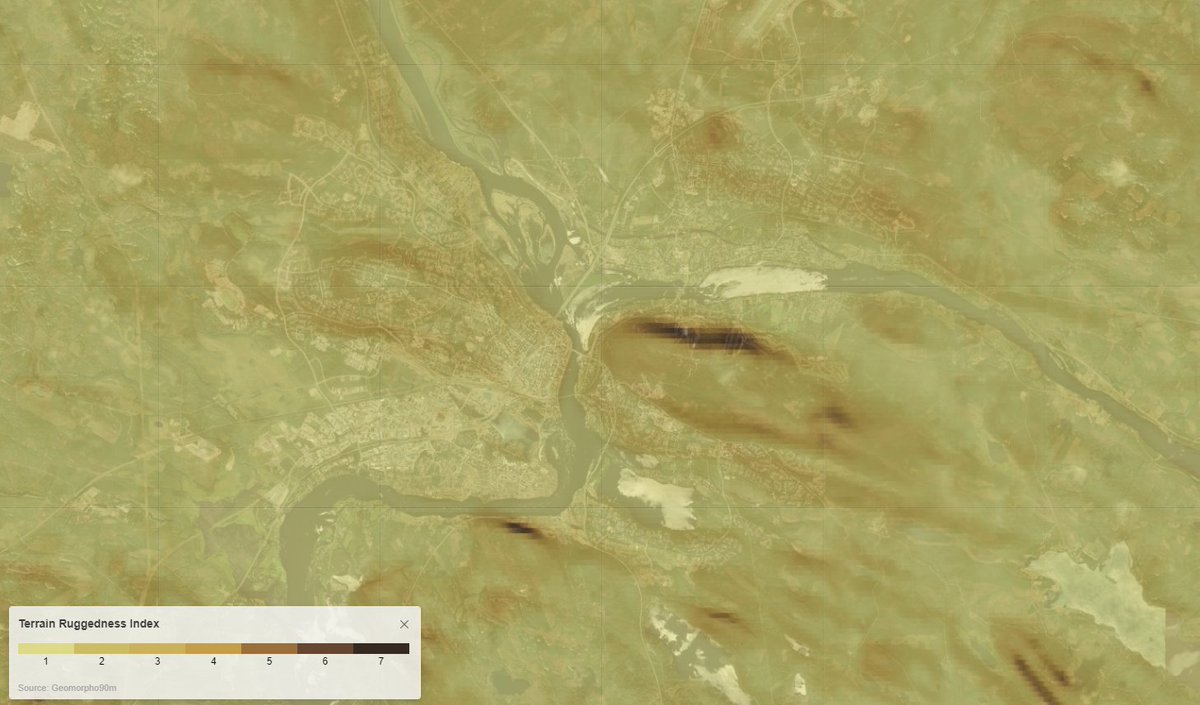
Merry Christmas and Happy Holidays with some inquisitive maps from Rovaniemi - the capital of Lapland in northern Finland - but most importantly the "official" home-town of Santa Claus!
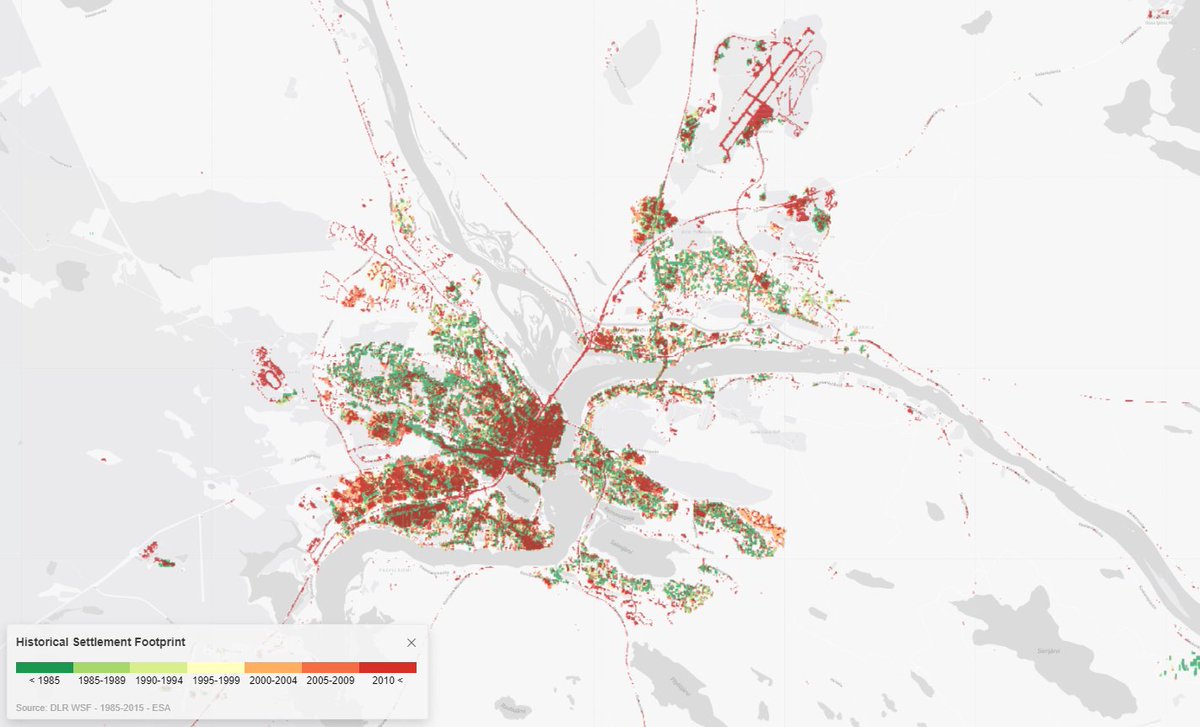
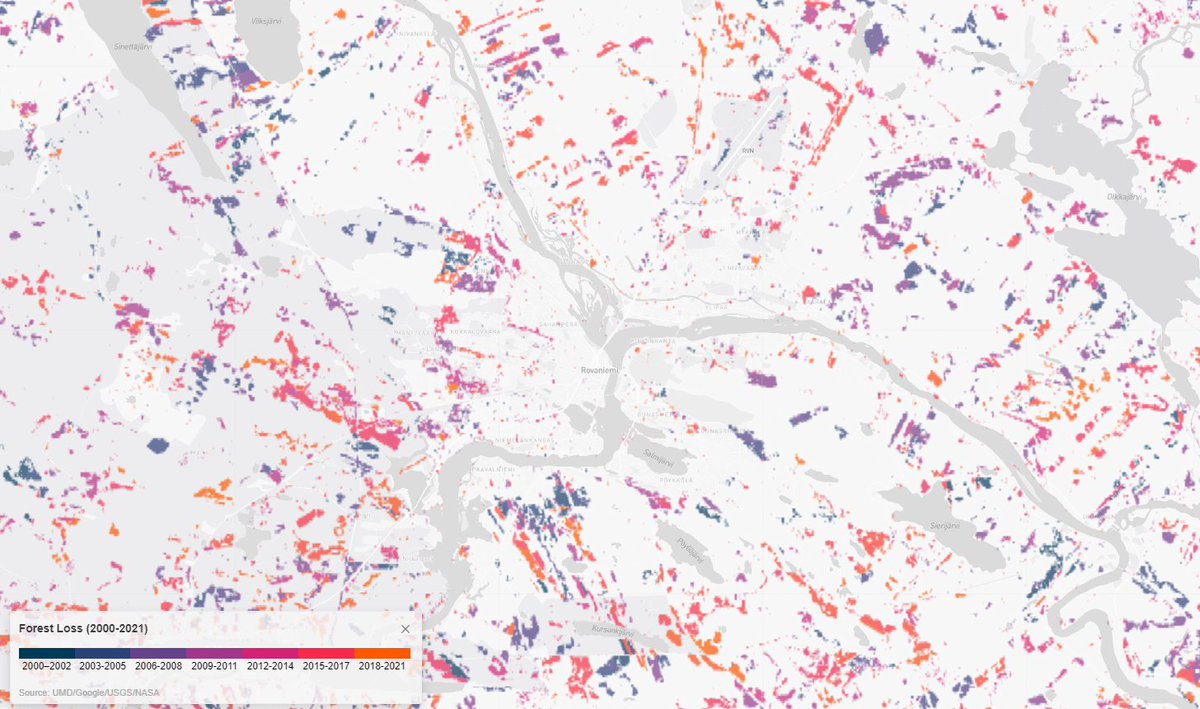
Quite a bit of forest loss in the past twenty years demonstrating increased activity in the elven toy factories. The city was actually designed by Alvar Aalto after being largely destroyed during the second World War: the historical settlement footprint map illustrates the touch of the architect with the city being designed in the shape of a reindeer's head. The rugged terrain probably accounts for the need of magic reindeer to get around.
Understand the context of your project better within seconds! All users who sign up to our platform currently get access to 26 different spatial data layers for free with global coverage and daily updates.
Here's a sample of four combinations: Tirana: Land Surface Temperature + Education Hexessibility Milan: Public Transportation Accessibility + Multiple Accessibility Index Istanbul: Forest Loss + Nightlight Activity Paris: Green Canopy Height + Average Building Cover Percentage
In this podcast, we dived into the shift towards a more decentralized and organic approach to city planning with Joni Baboci, an architect, planner, and urban enthusiast. @getlayerxyz#CityPlanning#FromSeries4#Podcast
https://t.co/ERBPba0nHV
We take care of everything including sourcing all data for all cities in the world. We tailor our services to retail chains providing performance measurement crossed with data of existing properties, inventory optimization, & support for intelligent future expansion & growth.
Beyond Layer's extensive globally available data catalogue (https://t.co/wM1Hnmt7CB) we also offer customized data and spatial analytics tailored to the needs of a diverse set of clients.
Here's some work we conducted for an upcoming supermarket startup in Milan looking at main competitors that includes proprietary supply-gap, accessibility & demographic analytics based on our own datasets.
Researchers, professionals, & planners can use @getlayerxyz to study & compare the density/accessibility of a city's public transportation network. Here's an example from @ComuneMI with data from @openstreetmap, @WorldPopProject and custom analytics from @getlayerxyz.
4. Out Multiple Accessibility Index overlaying 19 indicators in providing a comprehensive view of service accessibility coverage at 10/15/30min walking distance intervals + overlaid with population density closest to each public transportation station.
Two new global environmental layers have just been added to our platform.📷Aboveground Biomass Carbon Density 📷 and Belowground Biomass Carbon Density 📷 measure the estimated amount of embedded carbon for any area on earth.
It refers to the amount of carbon stored in the vegetation and woody components of forests or other terrestrial ecosystems as well as plant material found beneath the soil surface, including roots and rhizomes, which store a significant amount of carbon.