The S&P 500 has now gained for 9 straight weeks.
At the same time, consumers are still spending despite slower income growth and a falling savings rate.
Here's what's driving the disconnect: https://t.co/UZJ59HIrsC
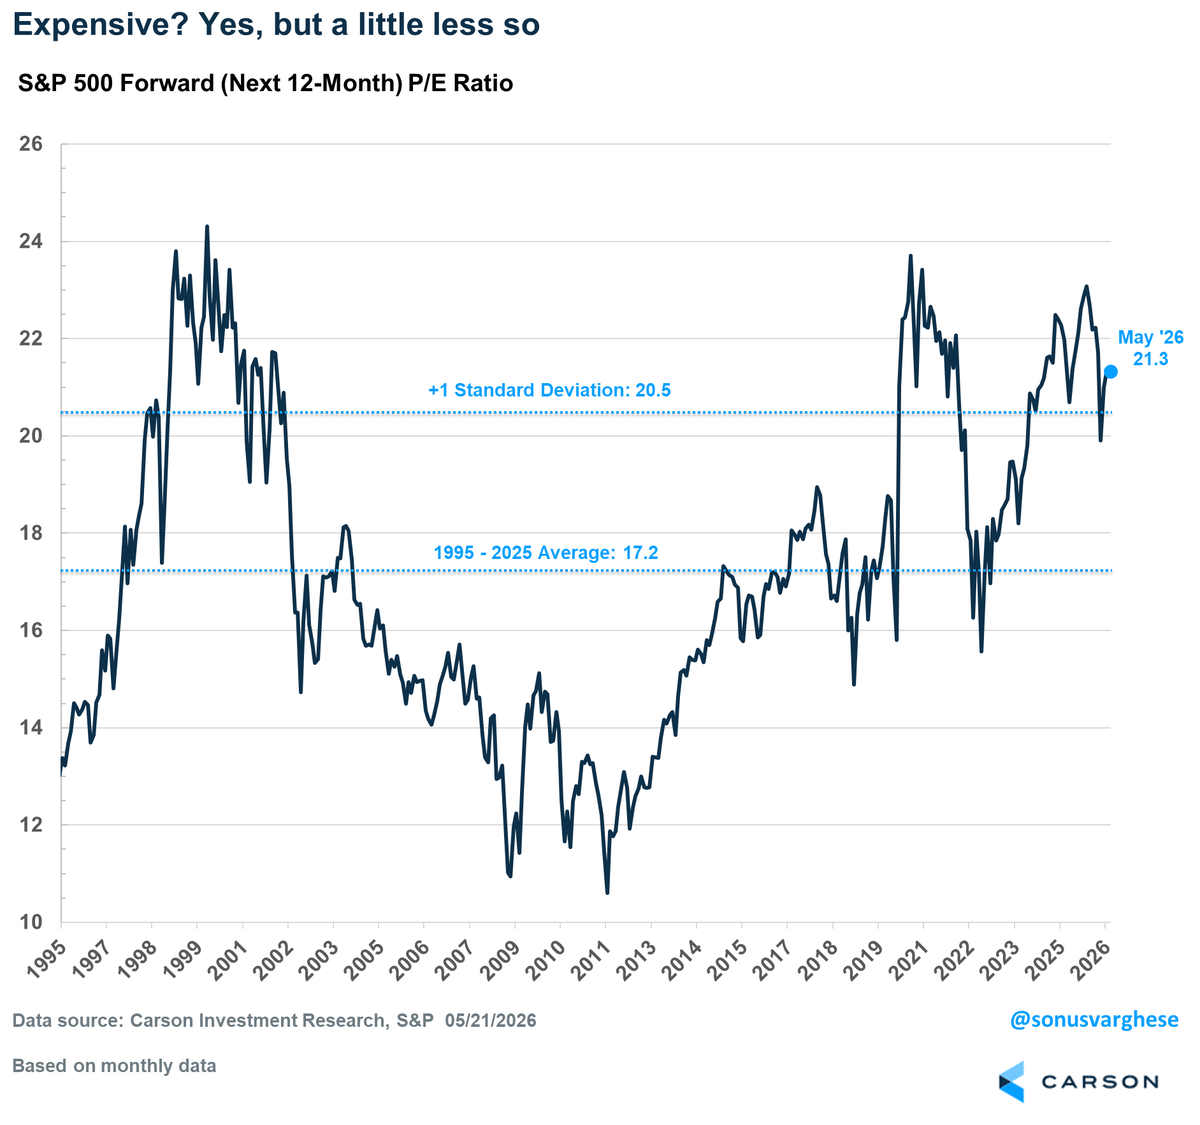
Are we in a bubble?
Our team says the sharper question is relative. One area's overvaluation is another's opportunity. Here's what's shifted since our 2026 Outlook:
https://t.co/Jx5OUPqvan
U.S. capital goods imports—which include the semiconductors and computing equipment fueling the data center buildout—rose a record 40.1% in the 12 months through April, according to trade data out this morning from the Census Bureau (https://t.co/dpi23PmCTa)
Day 100 of 2026 and the S&P 500 is up a very impressive 9.9% YTD.
22 other times it was up >9% YTD on this day and the rest of the year was higher 86.4% of the time (19 out of 22) and up another 8.1% on average.
This does little to change our overall bullish thesis.
The right question isn't how many positions you hold. It really comes down to whether each one has a purpose.
Complexity is fine when it earns its keep (diversification, tax management, targeted exposure).
Complexity for its own sake is just expensive packaging.
Own one S&P 500 ETF? You technically own 503 stocks.
97% of them sit at a 1% weight or less. 66% are under 0.1%.
Tons of tiny positions, you just don't see them.
Powell is out. Warsh is in.
The old narrative says new Fed chairs get tested by the market, but the data is a lot messier than the cliché.
@RyanDetrick dug into 8 weeks of gains, Powell's legacy, and what history says about new leadership.
https://t.co/1aGkRUWhJw
"How many positions should I have in my portfolio?"
It's one of the most common questions we get. The honest answer: it depends. But there's a useful way to think about it,
🧵
Once at @LPL I did our Morning Call on an hour of sleep after a full night out with our Advisors at Focus in San Diego. I had no prep and no idea what the market did the day before.
@jbuchbinder_LPL can verify, it was maybe the most impressive thing I did in 6 years there.
Stocks are acting like growth is still in charge. Bonds are acting like inflation is still the problem.
Our Market Commentary looks at why both can be true right now: https://t.co/ORSKSuufsf
The S&P is up about 9% YTD.
12-month EPS estimates are up an incredible 14%.
In other words, stocks are cheaper now than they were at the start of the year.
@RyanDetrick Over the 5.5 year period from 1978 to mid-1983, when inflation surged & Volcker raised rates to 15%+, the S&P 500 gained 77% (136% total return, 16.9% annualized)
Even from 8/6/79 (Volcker start)- 12/31/83, S&P 500 gained 35% (62% TR = 15.3% annualized)
https://t.co/VodzoZY9Jw
Inflation is still hot. Stocks are still climbing.
That disconnect may feel hard to reconcile for investors watching borrowing costs continue to rise.
More in this week’s Market Commentary. https://t.co/4DdF7DAwGP
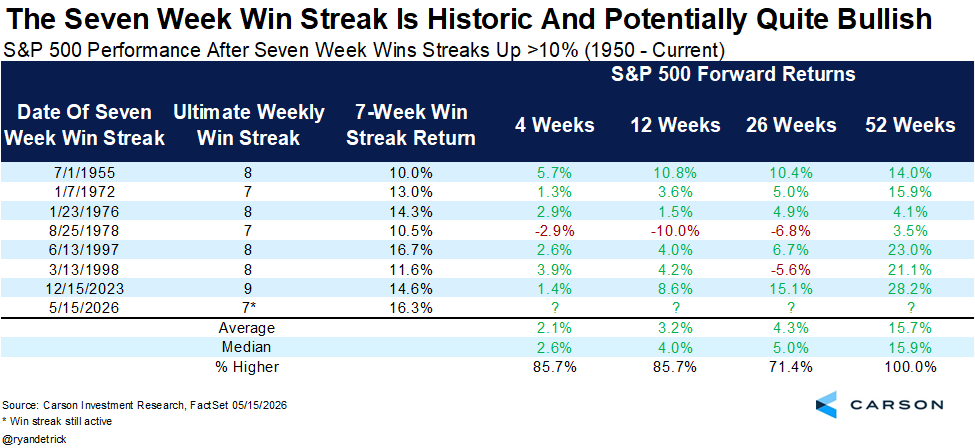
The last three times we had a 7 week win streak for the S&P 500 that was up more than 10% saw stocks up more than 20% a year later each time.
In fact, never lower a year later looking at all seven prior instances. I'd file this in the good news file.
Six months into 2026, Carson's inflationary-growth thesis is playing out. The labor market turned a corner, the AI wave got bigger, and inflation is still hot.
@sonusvarghese on why we're still riding the wave, and how we're guarding against a wipeout👇
https://t.co/QVjBEE5Fao
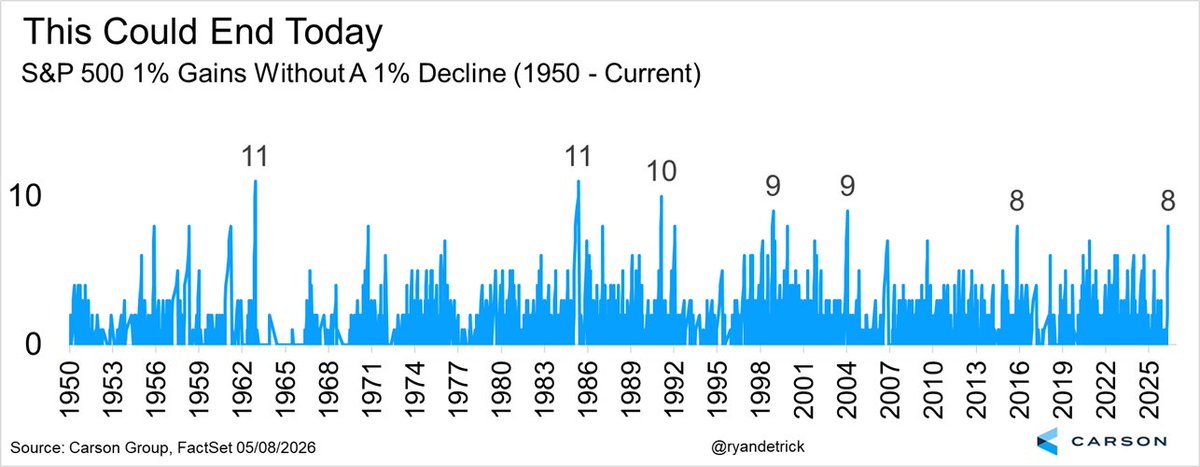
This streak could end today.
Eight 1% gains in a row without a 1% decline, longest in nearly 10 years.
Bottom line? A day like today was more than due.
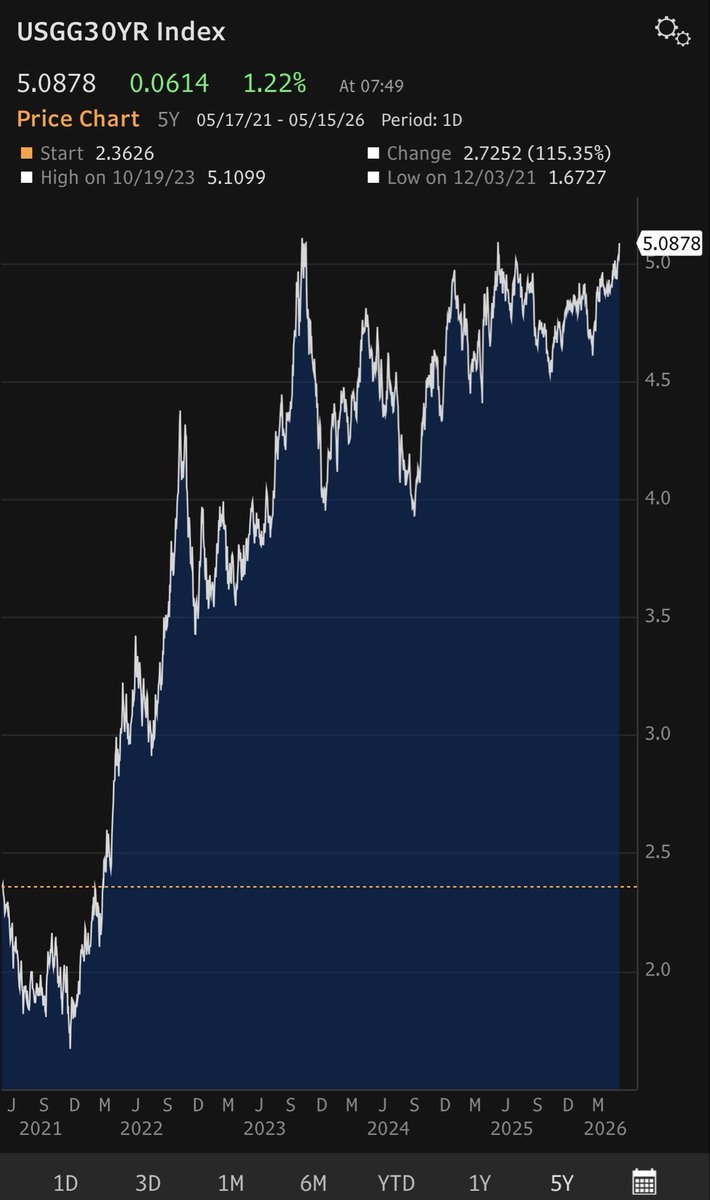
Looks like the bond market is reminding everyone that the Strait remains closed*
2y yields: 4.05
10y: 4.54
30y: 5.09
* And China isn’t going to do anything to help open it up