4/ What Actually Works
I wasted my first 2 years chasing frameworks.
Then I discovered this works better:
1. Pick ONE problem
2. Talk to 5 users
3. Map their actual behavior
4. Look for patterns
5. Test smallest possible solutions
Rinse and repeat.
Most bank CEOs don't know how their bank really works.
Most people IN banks don't know how it works either.
Because when you try to "just do something" in banking, you crash into an invisible wall of complexity that goes DEEP.
Meet the compliance iceberg 🧊
🧵
@sytaylor This is a great breakdown, one added dynamic which is useful is that each of these departments have different Executive reporting lines with their own “strategy” - drives all sorts of crazy forums, forms and behaviours. Now try integrate a FinTech/new tech into that…
“Most product managers think they’re doing strategy, but they’re not."
“I hate founder mode. Just because you're really good at going from zero to one does not necessarily mean you can take a company from 20 million in ARR to 150 million in ARR to like a Facebook size.”
That’s just two of the many eye-opening insights from Melissa Perri, Author of Escaping the Build Trap.
—
In today’s episode, we dive into:
→ The science behind crafting a winning strategy
→ The 5 layers of strategy every pm must master
→ Prioritization perfected: mastering the cost of delay concept
→ “Product Kata”: the iterative framework that drives success
→ Proven advice on how to land your dream PM job
—
𝗟𝗶𝘀𝘁𝗲𝗻 𝗻𝗼𝘄:
Spotify: https://t.co/4COO8cILOv
YouTube: https://t.co/0Ir35U3QvR
Apple: https://t.co/bK679mrXvy
—
𝗧𝗵𝗮𝗻𝗸𝘀 𝘁𝗼 𝗼𝘂𝗿 𝘀𝗽𝗼𝗻𝘀𝗼𝗿𝘀:
Enterpret: Transform customer feedback into product growth with custom AI - https://t.co/KYPuxYdkTz
Anvil - Document SDK: The fastest way to build software for automating documents - https://t.co/YXkXZBzKxm
Dovetail: The Fastest Way to Understand Your Customer - https://t.co/VWF48ohZPY
—
𝗞𝗲𝘆 𝗧𝗮𝗸𝗲𝗮𝘄𝗮𝘆𝘀:
1. Be a Decision-Maker, Not Just a Facilitator
Your role isn’t just about taking notes in meetings or simply coordinating tasks across teams.
At its core, it’s about making tough decisions, owning the outcomes, and driving the product forward.
She shared an example was of a junior PM who struggled with over-collaboration.
This PM frequently delayed decisions, trying to build consensus among multiple stakeholders.
However, when he adjusted his approach and included only the “right decision-makers,” everything improved: faster delivery timelines, higher team morale, and more impactful outcomes.
—
2. Discovery Never Ends: Why PMs Need to Embrace Continuous Discovery & Product Kata
PMs who rely on static discovery phases risk building products based on outdated assumptions.
Continuous discovery, combined with iterative frameworks like Product Kata, allows for real-time validation and adaptation.
Here’s how:
→ Start with a big goal, break it into smaller challenges, and iterate through experiments to validate solutions.
→ Validate ideas with users at every stage — not just after building everything — to ensure you’re addressing the right problems.
→ Engage designers and engineers to align on discovery insights and shared goals.
—
If you want to improve your strategy, the full >2 hour episode is for you.
1/ Sam Altman gave low-income people $1,000/month for three years, no strings attached.
Now, the results of one of the largest guaranteed-basic-income studies are in.
Let's get into it.
Business growth lives or dies by working capital.
Two business A & B:
Both have the same P&L unit economics
Base Sales = $500k per month
Operating Profit Margin = 10%
Both start with $1m cash in bank.
Both hit a growth vein.
Sales start growing at 15% per month.
Assuming no operating leverage that mean each make operating profit of $1.5m inside 12 months.
But now let's assume both have different working capital models.
Business A has a long working capital cycle:
- 90 days of forward sales in inventory.
- Pays supplier on 30 day terms
- Gives customers 60 day terms
Business B has a leaner working cycle
- 30 days of forward sales in inventory
- Pays suppliers on 90 day terms
- Gives customers 30 day terms
The Income Statements would look identical for both businesses.
Yet when you look at cashflow they are night and day.
At the end of the year Business B is sitting pretty with $3.6m in the bank.
Business A is dead and buried by Month 5.
Optimizing the working capital cycle is one of the most high leverage things you can do for growth.
@BondHack Not at all and I hope tone came across as ok. I thought I would contribute where I can and as my payback for the work you did on Greensill coverage - which was fantastic and had me glued as we were trying to figure things out ourselves! Will keep an eye out for more on this :)
@BondHack Re: direct financing, typically a 3rd party is involved (check company, C2FO) it’s usually called “dynamic discounting”. Vendor financing does not rely on the underlying receivable (usually) and is more a loan from the buyer. Supply chain finance as a term itself needs clarity
@BondHack Interesting piece and good to see the disclosures opening the debate on a misunderstood area.
I would class vendor financing and direct financing as capital allocation questions rather than debt. The company essentially using its own balance sheet. Agree clarity is needed
@realEstateTrent Lost my phone after a concert. Went to use reception phone to realize I didn’t know her number! Separated from a group (with her brother), eventually caught the group. Brother messaged on my behalf 🤦♂️
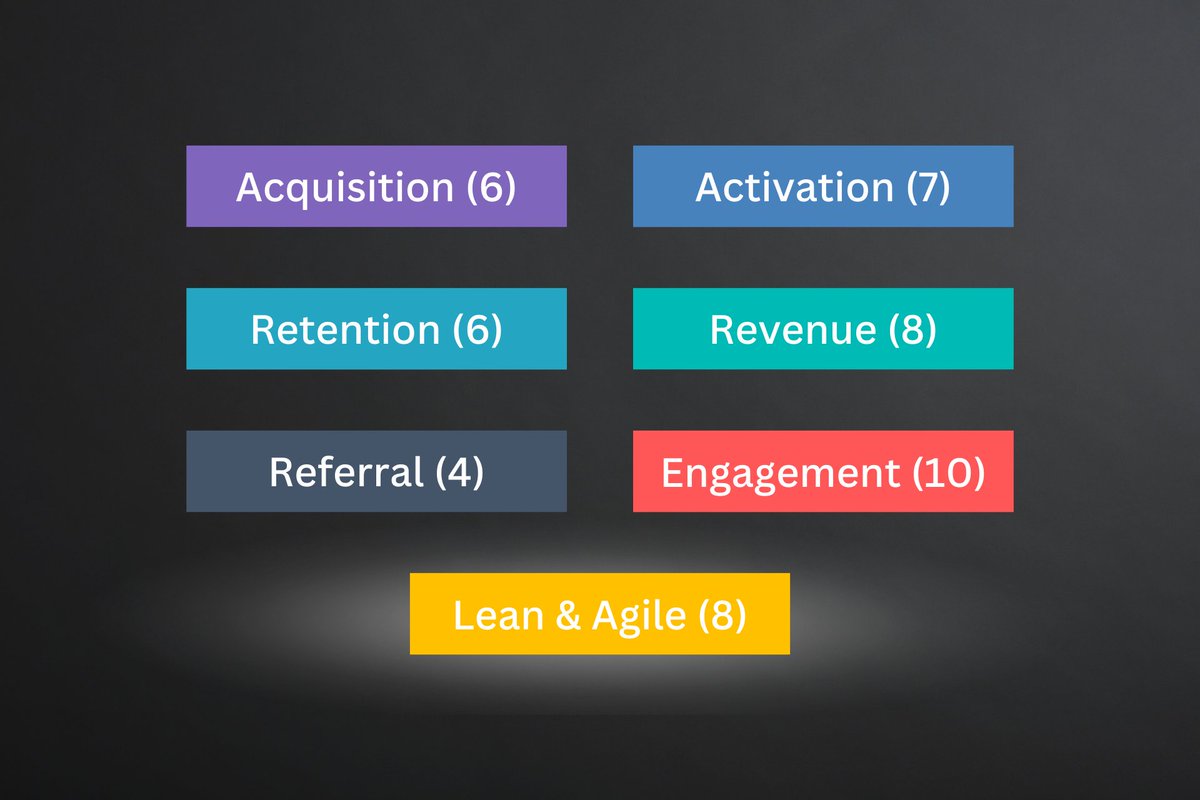
The Ultimate List of Product Metrics: Extended Edition
1. Acquisition Metrics
2. Activation Metrics
3. Engagement Metrics
4. Retention Metrics
5. Revenue Metrics
6. Referral Metrics
7. Lean and Agile Metrics
8. Conclusions and resources
The classification below is based primarily on the AARRR (Acquisition, Activation, Retention, Revenue, Referral) framework, which is universal, and fits every organization that works on customer-facing tech products.
On top of that, I added two categories:
Engagement Metrics: I want to emphasize the distinct metrics focusing on user interaction with the product. More in the 3rd point.
Lean and Agile Metrics: Metrics related to the effectiveness of delivering value. Some of them, like Time to Market (TTM) or Time to Learn (TTL), are essential to succeed by quickly adapting to the changing market conditions.
Without further ado:
1. Acquisition Metrics
1.1 Bounce Rate
The percentage of visitors who leave your website after viewing just one page. A high bounce rate may indicate issues with the landing page (e.g., messaging) or targeting.
1.2 Conversion Rate
The percentage of users who take a desired action, like signing up for a newsletter.
1.3 Landing Page Conversion Rate
The percentage of visitors who take a desired action on a specific landing page, like signing up or starting a trial, on a specific landing page.
1.4 Cost of Customer Acquisition (CAC)
The cost of acquiring a new customer through marketing and sales efforts.
1.5 Channel Effectiveness
The success of each acquisition channel in driving traffic, sign-ups, or purchases.
1.6 Traffic Source Distribution
The breakdown of incoming user traffic by different sources, such as organic search, referrals, or paid ads.
2. Activation Metrics
2.1 Time to Value (TTV)
The time it takes for a user to experience the core benefits of your product after starting to use it. A shorter TTV leads to higher user satisfaction, engagement, and retention. In product-led growth, optimizing TTV is crucial to ensure users quickly understand the value your product delivers.
2.2 Onboarding Completion Rate
The percentage of users who complete the onboarding process successfully.
2.3 User Activation Rate
The percentage of users who successfully complete a certain milestone in your onboarding process.
2.4 Trial-to-Paid Conversion Rate
The percentage of trial users who convert into paying customers.
2.5 First-time User Conversion Rate
The percentage of first-time users who complete a desired action, such as creating an account or purchasing. This metric helps assess the effectiveness of the onboarding process.
2.6 Product Qualified Accounts (PQA)
“In product-led sales, the product determines Product Qualified Accounts (PQA) to indicate when an account is prepared for sales engagement and potential conversion.” - @ElenaVerna, link in my full article
2.7 Product Qualified Leads (PQL)
“PQLs, or Product Qualified Leads, are the people within the existing self-serve user base with buying power.” - @ElenaVerna, link in my full article
3. Engagement Metrics
Engagement Metrics can be considered part of the Retention and, depending on the context, Activation (e.g., Session Length). I presented them as a separate category to emphasize the distinct metrics focusing on user interaction with the product.
3.1 Daily Active Users (DAU)
The number of unique users who engage with the product daily.
3.2 Monthly Active Users (MAU)
The number of unique users who engage with the product monthly.
3.3 Stickiness
The ratio of daily active users (DAU) to monthly active users (MAU), which indicates how often users engage with the product.
Stickiness = DAU / MAU
3.4 User Satisfaction (CSAT)
A measure of how satisfied users are with the product, often determined through surveys or in-app feedback (e.g., Pendo, Gainsight).
3.5 Session Length
The duration of a user's interaction with the product during a single session.
3.6 Session Frequency
The average number of sessions per user within a specific time frame.
3.7 Feature Usage
The frequency and depth of usage for specific product features.
3.8 Customer Effort Score (CES)
Measures the ease with which customers can interact with your product or service. It is often determined by asking users to rate the effort required to accomplish a task or resolve an issue on a scale from very low to very high effort.
A lower CES indicates a more user-friendly product, which can lead to higher user satisfaction and loyalty.
3.9 Task Success Rate
The percentage of users who successfully complete a specific task or set of tasks within your product. This metric helps assess the usability and effectiveness of your product's features.
3.10 User Feedback Score
A quantitative measure of user satisfaction gathered through surveys, ratings, or reviews.
There isn't a single standardized method or rating scale. This could be a numeric scale (e.g., 1 to 5 or 1 to 10), a star rating, or a qualitative scale (e.g., poor, average, excellent).
4. Retention Metrics
4.1 Churn Rate
The percentage of users who stop using the product within a specific period, e.g., monthly.
4.2 User Retention Rate
The percentage of users who continue using the product after a specific period. Often monthly.
4.3 User Renewal Rate
The percentage of users who renew their subscription or continue using the product after their initial contract period.
4.4 Customer Lifetime
The average time it takes for a user to stop using the product.
Customer Lifetime = 1 / Churn Rate
4.5 Customer Health Score
A composite metric that combines multiple indicators, such as usage, satisfaction, and support interactions, to provide an overall assessment of the customer's relationship with the product.
4.6 Product Adoption Rate
The percentage of users who adopt new features or functionality within a certain time frame after release.
5. Revenue Metrics
5.1 Average Revenue Per Account (ARPA)
The average revenue generated per account (customer) within a specific time frame. For example, monthly.
5.2 Customer Lifetime Value (CLV/LTV)
The total revenue a user generates during their entire relationship with the product.
CLV = Customer Lifetime * ARPA
5.3 Customer Profitability
The difference between the lifetime value of a customer (LTV) and the cost of acquiring them (CAC).
5.4 Monthly Recurring Revenue (MRR)
The predictable revenue generated by a subscription-based product every month.
5.5 Expansion Revenue
Additional revenue generated from existing customers through upsells, cross-sells, or add-on purchases.
5.6 Net Revenue Churn
The revenue lost due to customer cancellations, downgrades, or non-renewals within a specific period, typically a month/year.
5.7 Net Revenue Retention
The cumulative sum of retained, contracted, and expanded revenue over a specific period, typically a month or year.
5.8 Average Contract Value (ACV)
The average revenue generated from each customer contract, which can help assess the effectiveness of pricing and packaging strategies.
6. Referral Metrics
6.1 Virality Coefficient
The number of new users acquired through referrals by existing users. Often expressed as a ratio (<1, 1, >1).
6.2 Customer Referral Rate
The percentage of customers who refer others to the product.
6.3 Referral Conversion Rate
The percentage of referrals that convert into active users.
6.4 Net Promoter Score (NPS)
A measure of customer satisfaction and loyalty based on how likely users are to recommend the product to others.
NPS = % of Promoters - % of Detractors
(-100 to 100)
Warning: NPS measures customer attitude and sentiment, not the actual behavior.
7. Agile and Lean Metrics
Before we dive in, it's important to remember that Kanban aims to optimize the flow of value, not the flow of work
So, for example, if you use User Stories and sub-tasks, focus on tracking the whole User Stories, not individual sub-tasks.
7.1 Lead Time
A Kanban metric that measures the total time between an idea placed in a Product Backlog until the work in a specific process is completed.
For example, if Microsoft decides to use ChatGTP in Bing, Lead Time would be the time between deciding on a specific approach and when the feature is production-ready.
7.2 Time to Market (TTM)
Time to Market (TTM) is a broader concept, encompassing idea generation, experimentation, product delivery, and pre-launch activities that might be required before an idea is shipped.
For example, if Microsoft decides to incorporate ChatGPT into Bing, the TTM would be the period between having a draft idea and when customers can use a new capability.
7.3 Cycle Time
A Kanban metric that is a component of Lead Time. It measures the time it takes from when the implementation of an idea begins until it's done.
For example, if Microsoft decides to incorporate ChatGPT into Bing, the Cycle Time would be the period between when developers start implementing a specific idea and when it becomes production-ready.
7.4 Work In Progress (WIP)
WIP is a Kanban metric that represents the number of ideas that your team is currently working on.
The goal is to limit WIP to reduce context-switching and minimize the Cycle Time. This ultimately minimizes the Time To Market (TTM).
7.5 Throughput
The rate at which ideas pass through your team's workflow over a given period.
...
Continue reading for free
Due to character limit, continue reading for free here (no email, no paywall): https://t.co/A9wp0GTGNc
- Visualizations
- Lean and Agile metrics
- Conclusions
- Additional techniques
- Free resources
Hope that helps!