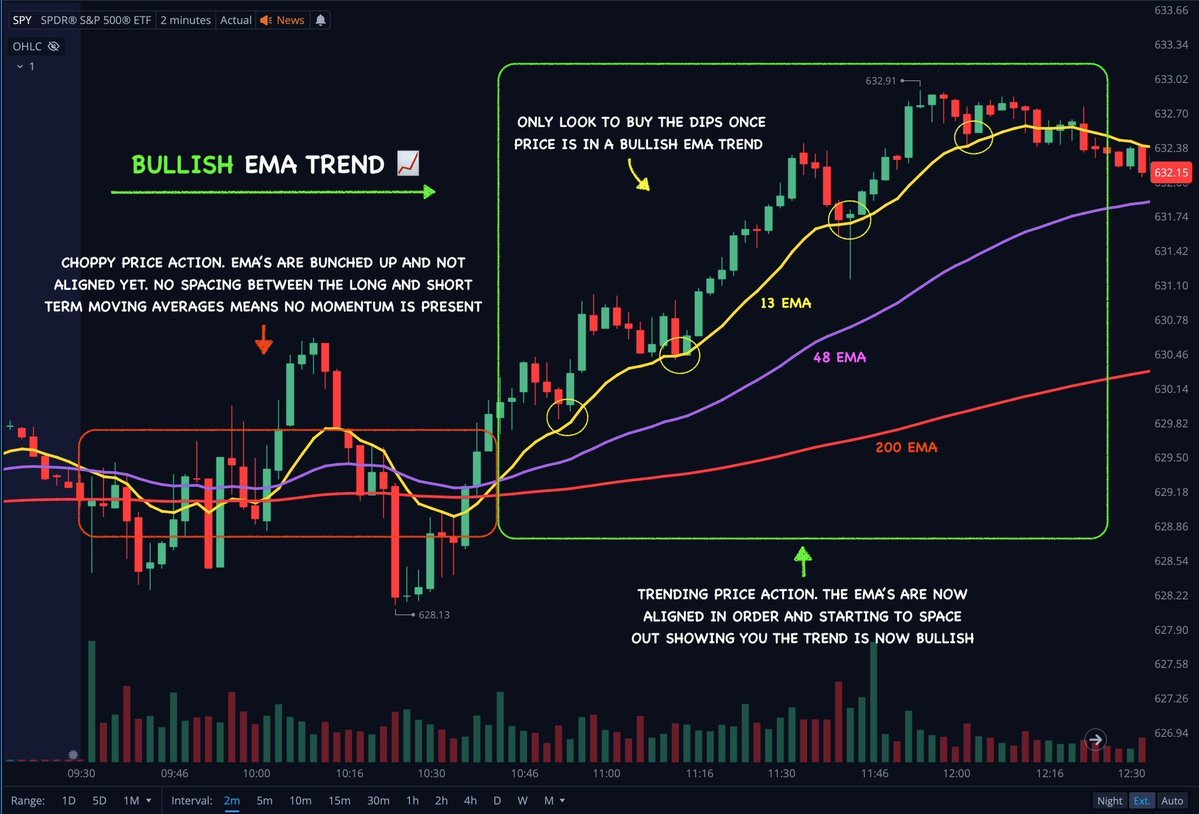
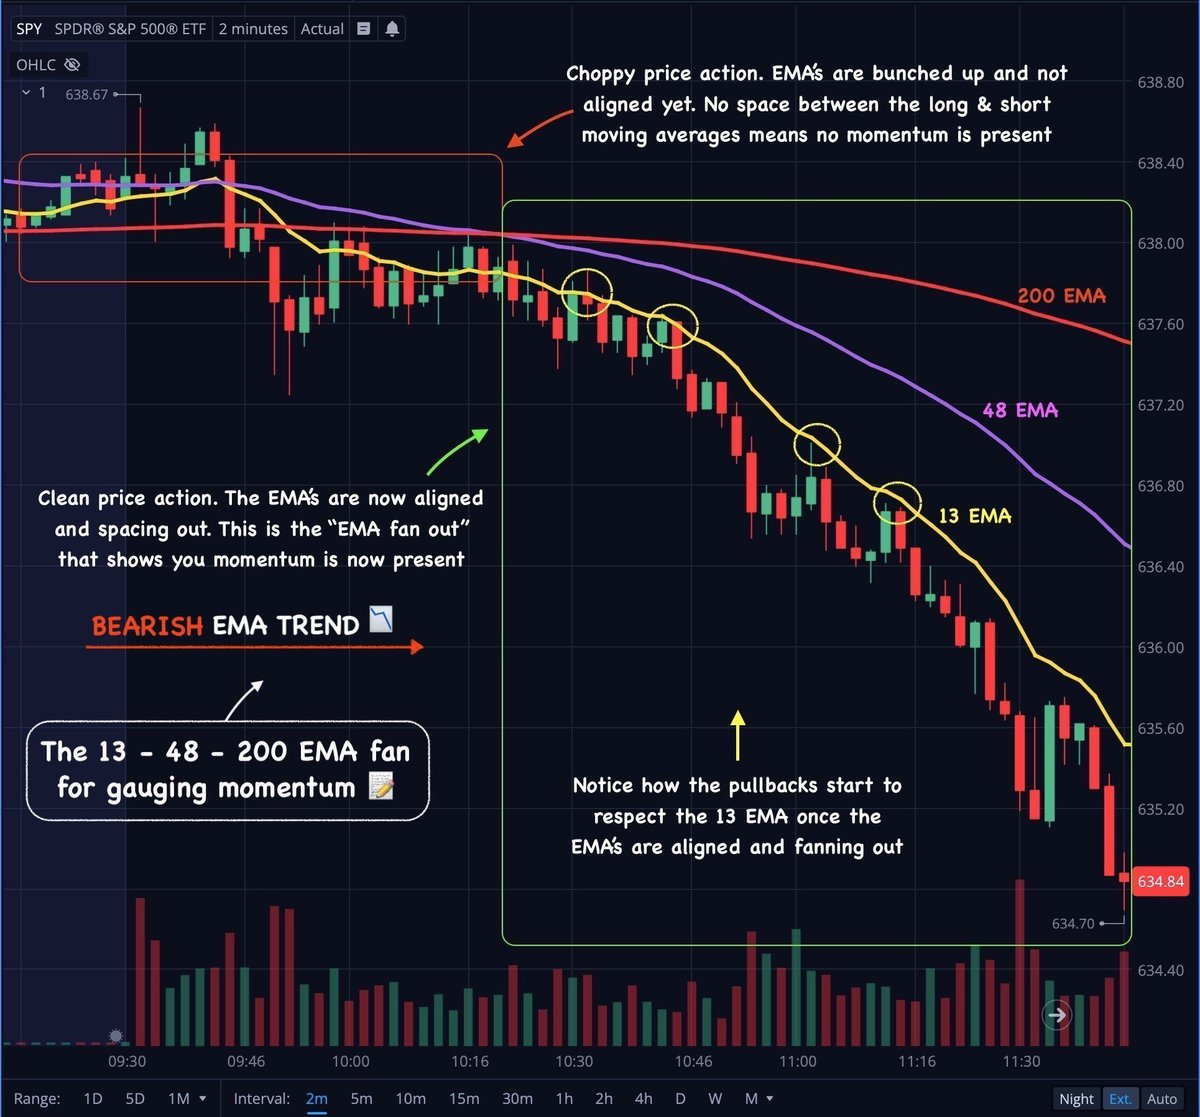
$SPY • How to use EMA’s to identify compression (chop) vs expansion (trend).
This is the single most helpful trading lesson I ever learned. Hands down.
Everything from directional bias, to entry & exits, to my patience during chop, all improved by this technique.
This is just a quick mockup on my phone. I’ll go into detail on how to better utilize these later 👇
SMART MONEY CONCEPTS CHEAT SHEET.
The exact sequence for clean entries:
✓ EQH → CHoCH: Liquidity sweep into a trend shift.
✓ BOS → FVG: Momentum confirmation leaving an imbalance.
✓ Entry: Retest of the FVG with SL above the supply zone.
Save this to learn letter.
Today my $SPY puts ran over 1,000% 🤯
I love how these trades for over 100%+ are starting to feel like base hits haha.
That’s the type of volatility we love!! 🙌
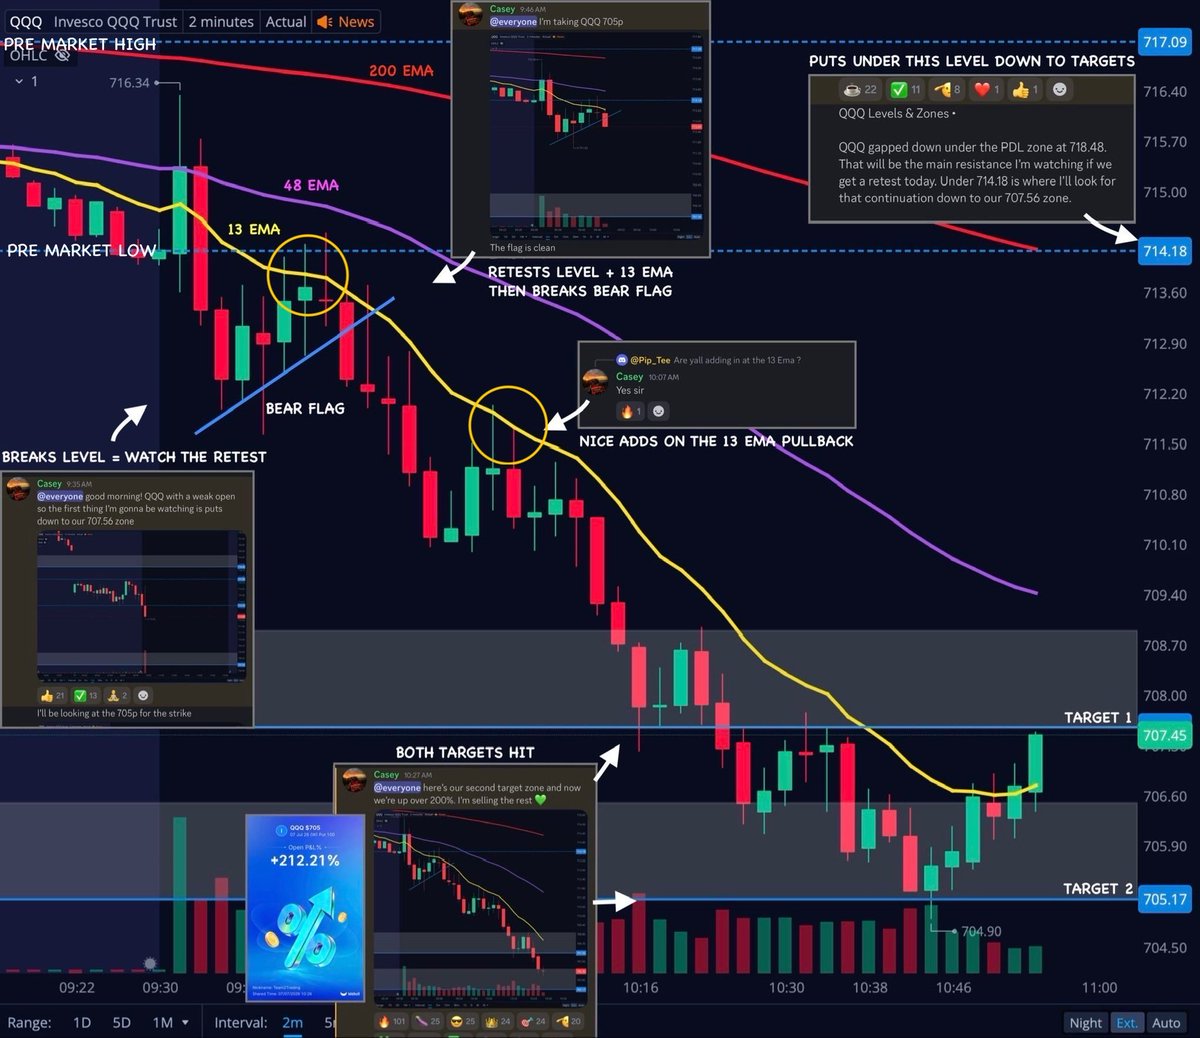
$QQQ Levels & Zones 🎯
If you watch the charts long enough, you will notice that the market plays out the same couple of scenarios every single day.
And this is one of them 👇
Most 0DTE traders will never learn this about the SPX expected move.
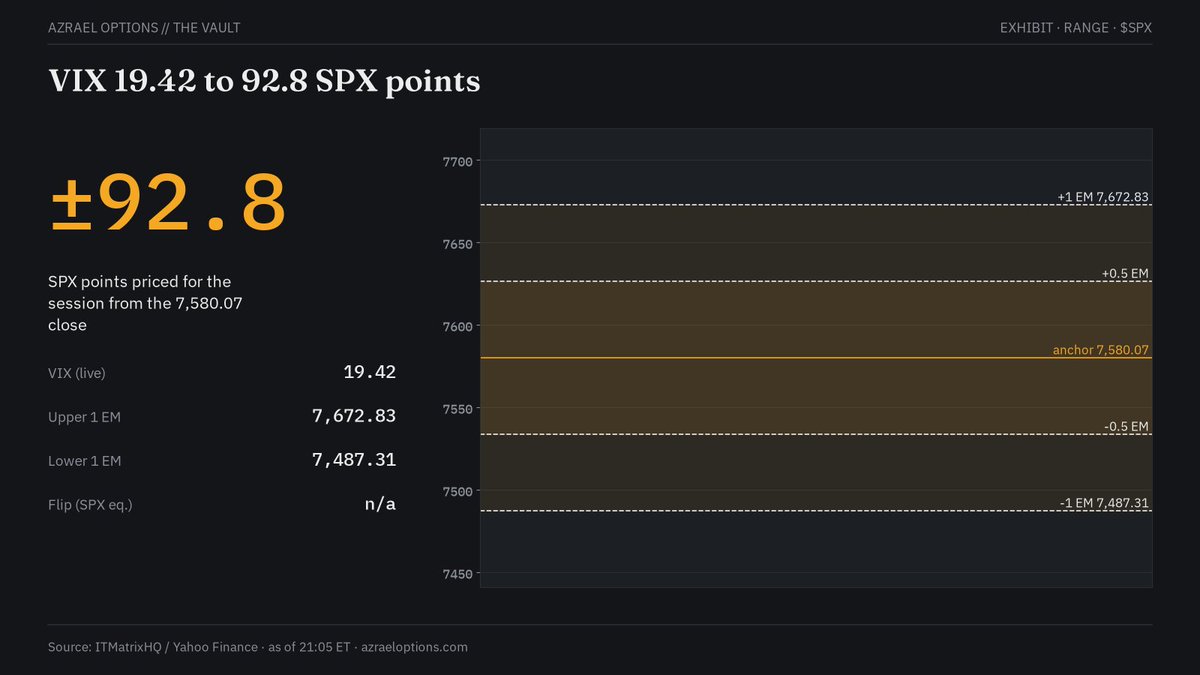
$SPX is priced to move 92.8 points on Monday from a 7,580 close.
The range map shows every line from 7,487 to 7,673.
Same index. Same close. One clear map.
The expected move isn't a target. It isn't a promise. It's the range options are paying for.
Here's the full breakdown 👇
How the expected move works:
→ VIX is the market's fear gauge, and it sits at 19.42 right now.
→ 19.42 divided by 15.87 gives about 1.22% a day.
7,580.07 x 19.42% / 15.87 = 92.8 points
→ That puts Monday's range at 7,487 to 7,673.
→ The halfway lines sit at 7,534 and 7,626.
→ About 51 of the 93 points tend to show up before 11:30 AM.
Where the dealer lines land:
→ GEX is a map of where option dealers hedge the most.
→ A strike is the price an option is locked to.
→ The put floor is the big put strike at 7,523, which is SPY 750.
→ The call ceiling sits far up at 8,024, which is SPY 800.
→ The flip line at 7,736 is where dealers switch from calming price to chasing it.
→ SPX sits below that line, so the regime is FAST and moves can run.
What to do Monday:
1. Before 9:30 AM, see if SPX is above or below the 7,534 and 7,626 halfway lines.
2. Mark 7,624, where 3 separate levels stack right on the upper halfway line.
3. Use the 10.0303 ratio to turn SPY strikes into SPX levels before the bell.
Trade inside the map, not inside your hopes.
The Vault posts this band, the halfway lines and the dealer walls before 9:30 AM.
Every stop there is an SPX level in points, written before any idea.
This is the math The Vault writes every morning for SPX, SPY and /ES before 9:30 AM: every price line, with the price that proves it wrong right next to it.
A seat is $397 once or $97 a month. The link is in the reply under this post.
I’ve been watching the charts every day for nearly a decade now…
These 3 things remained so consistent they forced me to make them the foundation of my trading system 📝
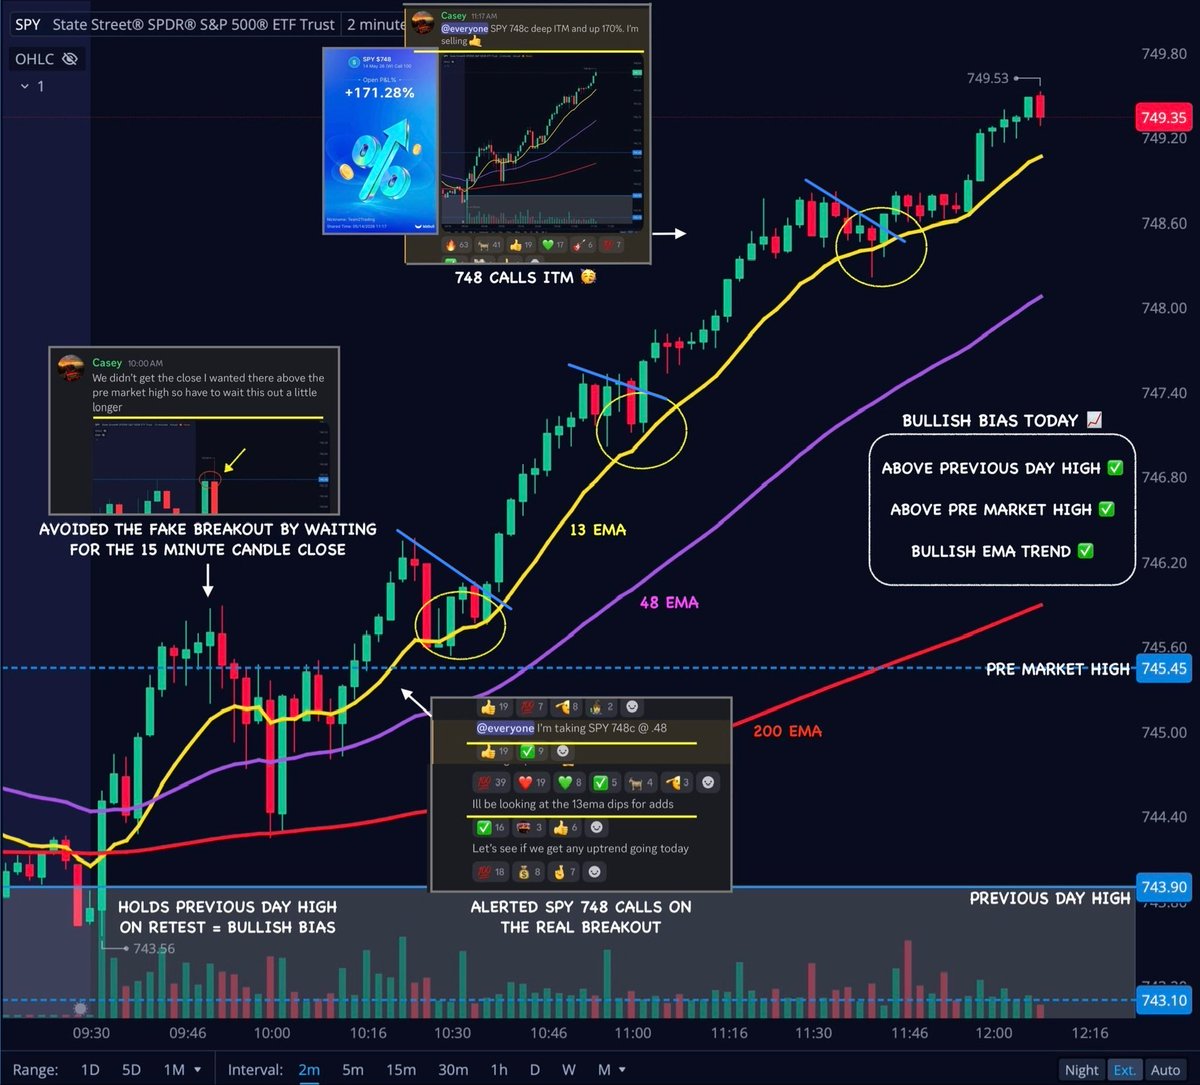
1️⃣ Always mark these 4 levels 📌
Previous Day High ✅
Previous Day Low ✅
Pre Market High ✅
Pre Market Low ✅
2️⃣ Follow the EMA trends 📌
13ema 🟡
48ema 🟣
200ema 🔴
3️⃣ Bull / Bear Flags 📌
I focus on Bull Flags above the Pre Market & Previous Day High 📈
I focus on Bear Flags below the Pre Market & Previous Day Low 📉
Narrowing my view of the market to these 3 things was a complete game changer for me.
It brought less noise & better trades 💚
$SPY $QQQ $IWM
I do this every single morning, no exceptions…
• Make a plan for the area i will focus on my upside / call setups 📈
• Make a plan for the area i will focus on my downside / put setups 📉
• Make a plan for the area i will sit on my hands and wait 🧘♀️
If / then trading. “If this happens, then I will do this”. Keeps you focused and patient. Allows you to react instead of predict.
It doesn’t take long and it sets you up with a gameplan for success before the market even opens 💚
$SPY $QQQ $IWM
Dealer Positioning / Heatmaps Class
LESSON 05: AIR POCKETS & VELOCITY
Have you ever watched $SPX have a hard time moving just 5 points and suddenly jump 30 points in a minute or two?
With no clear support or real resistance.
Just a fast move through what seems like empty air.
One of the biggest oversights in heatmap trading is what happens BETWEEN the major nodes.
Let's dive in 👇
Also LMK if these are helpful so we keep doing them.
Most blown 0DTE accounts have one thing in common: impulse entries before 9:50 AM.
Your whole $SPX trading window today is 100 minutes, 9:50 to 11:30 AM ET.
Same index. Same strike. Two clocks, two results.
The leak isn't your strike. It isn't your stop. It's your clock.
Here's the full breakdown 👇
The three times that run your morning:
→ 9:30 to 9:50 AM ET: no entry, only watch the first 20 minutes.
→ 9:50 AM: entries open, once price picks a side.
→ 11:30 AM: anything still open gets closed, win or lose.
→ After 11:30 AM: lunch chop, price drifts and your option keeps leaking.
What 100 flat minutes cost one call:
→ Theta = the value an option loses every hour.
→ One 7,670 call with SPX flat is worth $1,785 at 9:50 AM.
→ The same call with SPX still flat is worth $1,327 at 11:30 AM.
→ That is $458 gone with zero movement.
Where to aim inside today's box:
→ Priced move today is 93.4 points either way from 7,623.68.
→ Priced range is 7,530 to 7,717.
→ Modeled floor is 7,575, and modeled ceiling is 7,670.
→ Halfway lines sit at 7,577 and 7,670.
93.4 / 2 = 46.7 points, and 7,623.68 + 46.7 = 7,670.
What to do tomorrow morning:
1. From 9:30 to 9:50 AM, mark 7,577 and 7,670, and enter nothing.
2. From 9:50 AM, aim each trade at 7,670 or 7,577, never past 7,717 or 7,530.
3. At 11:30 AM, close everything, even a flat call already below $1,785.
Wait 20 minutes, trade 100, then close the app.
Every number above comes out of one line: the VIX divided by 15.87.
It is called The 15.87 Rule. It shows what the clock costs after 11:30, and why the window closes when it does.
16 pages, free download. Click the link below or in my bio.
Backtest and study the way price reacts to these 4 levels…
Previous day high ✅
Previous day low ✅
Pre market high ✅
Pre market low ✅
Then study the way price reacts to these EMA trends…
13 EMA 🟡
48 EMA 🟣
200 EMA 🔴
Now learn to spot these 2 simple chart patterns…
Bull Flag 📈
Bear Flag 📉
Once most people go through this process… they find out that it’s all they need as far as technical analysis goes 👊
$SPY $QQQ $IWM
We asked Claude for a trading dashboard.
The Unusual Whales MCP did the rest: options flow, GEX, dark pool prints, built in three steps. Prebuilt examples to give you a head start.
What to look for when trading short termed options 0-4 DTE and how I caught a 800% 0Dte play on $AMD on Friday 7/17:
* I am not a financial advisor. This worked for me, but may not work for you.*
For 0-4 DTE, less is more — a 5-min execution chart anchored to VWAP and hard levels beats indicator stacks.
Here’s my ranked breakdown:
1 - Chart intervals
•5-min = primary execution chart; 1-min only for timing fills on 0DTE
•15-min for intraday structure, daily for marking levels premarket (prior day H/L, premarket H/L, open)
2 - Top indicators (in order)
•VWAP — the #1 tool at this DTE. Above = long bias, below = short bias; reclaims and rejections are your cleanest triggers
•9/21 EMA on the 5-min for trend filter; 200 EMA on the 5-min acts as a magnet/major level
•Volume + RVOL — no breakout is real without it, and RVOL tells you what’s actually in play
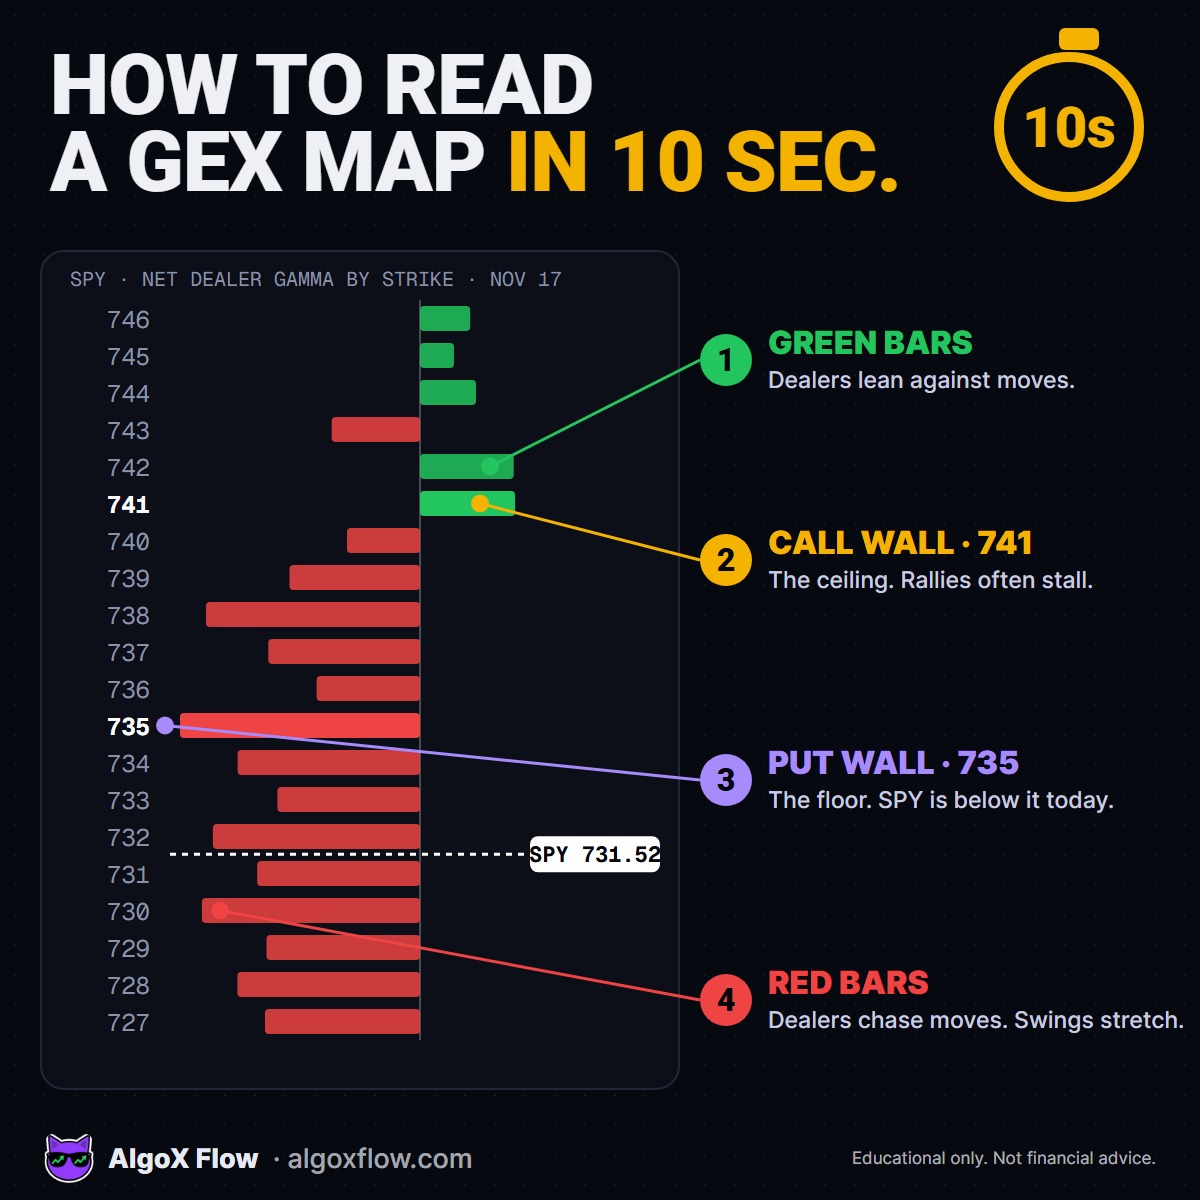
•Gamma exposure levels — call wall, put wall, gamma flip. Positive gamma days pin and chop; negative gamma days trend hard. Pull these from UW by strike — this is the biggest edge most 0DTE traders skip
•RSI divergence at extremes (skip raw overbought/oversold in a trend)
•For SPY/QQQ/SPX: TICK and ADD internals beat most chart indicators
Your SuperTrend/MACD are fine on 15-min for context but lag too much for 0-1 DTE entries, so 5 min is ideal.
3 - Signals worth taking
•Opening range break (first 15 min) with volume
•VWAP reclaim after a flush, or rejection on retest
•Break-and-retest of premarket/prior-day levels
•Failed breakout / stop-sweep reversal at a marked level
•Flow confirmation — your scan already covers it: ask-side buying, vol > OI on the strike you’re eyeing
*DTE-specific notes
•Time of day is as important as any indicator: 9:30–11:00 and 3:00–4:00 ET have the moves; lunch chop + theta bleeds 0-1 DTE longs fast
•Favor ~0.30–0.70 delta so a quick move actually pays — under my $1,000 per play with a minimum of 8 cons risk-cap that’s slightly OTM SPY/QQQ and further OTM on SPX
•Penny-wide spreads only; slippage at this DTE is a silent killer. * for the most part this is true but certain cases not so much for example on Friday $MU and $MRVL which have large range premiums per Contract Hit over 1000% on calls after the morning dip. But I generally do stay away from. Widespread. Options, especially if it’s 0DTE.
I am going to follow up this post with my AMD trade explained using these parameters , also will post a way to automize this using a few AI tools (basic knowledge of APIs/coding will help)