New deep dive research:
RS Technologies: A Mispriced Leader in the Semiconductor Supply Chain
▪️RS Technologies (3445 JP) evolved from a distressed asset — the 300mm wafer reclaim line that Rasa Industries sold for a fraction of its value following the Lehman shock — into one of the leaders in the small but growing silicon wafer reclaim market. CEO, founder, and controlling shareholder Ho Nagayoshi owns 43.87% of the company, while insiders and affiliated parties collectively control 50.59%.
▪️The wafer reclaim market is a concentrated oligopoly, with the four largest players controlling roughly 70% of global capacity. RS Technologies is one of the industry’s leaders. The business model is predominantly service-based: ownership of the wafer remains with the customer, while RST generates revenue by providing reclaim services. Test and monitor (”dummy”) wafers remain an essential consumable for maintaining manufacturing yield regardless of end-market semiconductor demand.
▪️The wafer reclaim business is the company’s core segment, generating approximately 35% of revenue, 64% of operating profit (or roughly 75% excluding subsidies in the prime wafer segment), with operating margins in the high-thirties and ROIC above 20%. Both of the company’s key facilities (Japan and Taiwan) are currently operating at 100% utilization, running 24/7 across three shifts amid the AI-driven semiconductor boom. We expect segment revenue growth to accelerate from the current mid-teens to the high-twenties over the next several years, while operating profit could increase by approximately 77% between 2025 and 2028.
▪️Demand is being supported by two structural tailwinds. The first is the construction of new fabs: more than 60 semiconductor fabs are currently under construction worldwide, including 11 in Japan and 9 in Taiwan, while TSMC has raised its 2026 CapEx guidance to $60-64 billion. The second is the migration toward leading-edge process technologies. Reclaimed wafer consumption intensity increases by roughly 3-4x for the same fab capacity (according to industry experts, from approximately 40k reclaim cycles per 50k wafer starts at 28nm to roughly 115k at 3nm and 135k at 2nm). To meet this demand, RST is investing ¥52 billion (~$324.6 million) to expand total reclaim capacity to 1.19 million wafers per month by 2028 (+72%), with Taiwan representing the primary expansion focus.
▪️The prime wafer business (approximately 26% of revenue and 26% of operating profit) is entirely China-based and is consolidated through publicly listed GRITEK (688432 CH), in which RST holds an effective 39.1% economic interest. This business is capital-intensive, generates ROIC below 5%, and is only beginning to emerge from a prolonged industry downturn. Its long-term outlook remains mixed due to the structural transition from 200mm to 300mm wafers and aggressive pricing by Chinese competitors. However, GRITEK’s public listing makes the segment a key source of hidden value within the group.
▪️Based on our model, we expect group revenue to grow at a 15.3% CAGR through 2028, operating profit at 19.5% CAGR, and net income at 19.8% CAGR, driven primarily by the increasing contribution of the higher-margin reclaim business. We forecast net income to exceed management guidance by 5%, 19%, and 23% in 2026, 2027, and 2028, respectively (management’s previous medium-term forecasts also proved conservative). While we expect free cash flow to remain deeply negative during the investment cycle, net debt should remain negative even if the entire expansion program is financed with debt.
▪️Even after accounting for these risks, the valuation appears exceptionally attractive — both on conventional relative valuation metrics and on common sense. RST trades at a substantial discount to direct peers such as Phoenix Silicon (8028 TT), Kinik (1560 TT), and Scientech (3583 TT) despite offering comparable business quality and growth prospects. Moreover, RST’s 39.1% stake in publicly listed GRITEK alone was worth ~$2.9 billion as of July 29, while the entire market capitalization of RS Technologies stood at only ~$926.7 million. In other words, the market is effectively assigning a negative value to the company’s highly profitable and rapidly growing wafer reclaim business.
Peter Lynch had 300% turnover per year in the early years of the Magellan Fund. Joel Greenblatt had similar turnover at Gotham Capital. Even Warren Buffett’s public company portfolio ranged between 50-100% turnover per year during his first three decades. In fact, contrary to what most believe, many of the greatest long-only investors had their best performance when they had higher rates of turnover in their portfolios. And these were investors that invested in larger, more established businesses where low turnover is much more achievable.
We invest in small emerging companies. Microcap companies evolve in different ways. Not all of them are good ways. We can’t say at the beginning, “I’m going to hold this stock for 1-5-10-40 years”. No, we are going to hold it as long as management executes and constantly compare them against other opportunities. We might hold them 3 months, or it could be 10 years. If I’m being honest, most companies only deserve to be rented. Ownership is earned. The quickest way to go broke in microcap is buy and forget. Buy and hold forever only works if management executes forever.
We’re working on a new Grana Insights piece. In my view, we’re about to highlight the biggest bottleneck in AI infrastructure - and a company that controls 50% of this market while trading at an ~8% FCF yield.
For context, at Grana, we’re not big believers in overly complex AI-related themes, and we tend to be cautious about the valuations we’re willing to pay for companies tied to this industry. That said, this story has genuinely caught our attention, and I see significant upside potential here.
Subscribe so you don’t miss it.
Global VP at Schneider Electric on Tecogen $TGEN:
“Tecogen technology is the new disruption which was not existing in this cooling market. That's why I heard them. I heard them this year, not last year. Last year, we did some monitoring, etc. This year, I have heard they are doing something. It can be pilot or some discussion. Our people have mentioned about their name and then seems like some prototype or some work or some discussion is coming through, but I haven't seen the competition with the tendering process they are coming yet.”
@Ad_Quant Maybe you are right. However in the article I provided a quote from manager at Voodoo and he said that Unity has made a significant progress in terms of ROAS
Our first Ideas Hub post is about Unity Software $U - a company that went through one of the deepest management crises in the gaming industry and now appears to be preparing to challenge AppLovin $APP.
Can Unity's new advertising algorithm, Vector, replicate AXON's success and become the inflection point for both the business and the stock?
It’s not totally correct. Fabs can cancel their reclamation orders if prime wafers prices are going down, because they can use prime wafers instead of reclaimed ones. For example there is no demand for reclaim wafers in China because prime wafers prices are very low (I got this insight during the discussion with the company’s IR)
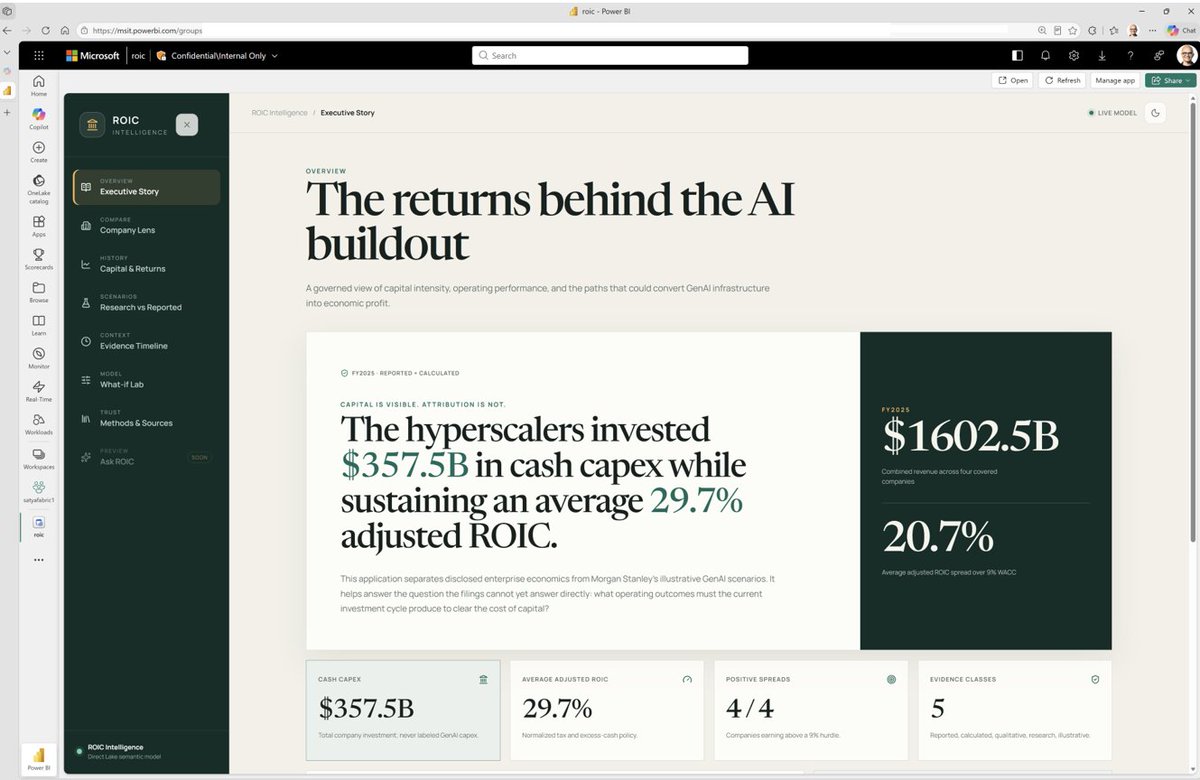
Some more detail on the ROIC Intelligence App I built yesterday and mentioned on today's earnings call.
I took the PDF that Brian Nowak at Morgan Stanley put together for Hyperscale ROIC this week and used Copilot code (coming in our new superapp) with a single prompt + skill (/drill-me) to create the plan, then used autopilot in auto to create the full app (with history, lookups, scenarios, what-ifs, etc). And /rubber-duck to test.
And the best part is that all the artifacts are in my enterprise environment. My app is in Copilot, my code is in GitHub Enterprise; all my data pipelines/lake/semantic models are in Fabric. And everything is under Agent 365 IT/Sec/FinOps control!
So this is not about Tokenmaxxing or vibe coding. Every step of the way the rails are engineered to create value, making everything a long-term reusable asset, with governance/security, and cost controls.
This is the full system to drive business value. Disclosures: This is all pulled from public sources, and for illustrative purposes only...not financial advice! :)
Here is the app and architecture...
New deep dive research:
RS Technologies: A Mispriced Leader in the Semiconductor Supply Chain
▪️RS Technologies (3445 JP) evolved from a distressed asset — the 300mm wafer reclaim line that Rasa Industries sold for a fraction of its value following the Lehman shock — into one of the leaders in the small but growing silicon wafer reclaim market. CEO, founder, and controlling shareholder Ho Nagayoshi owns 43.87% of the company, while insiders and affiliated parties collectively control 50.59%.
▪️The wafer reclaim market is a concentrated oligopoly, with the four largest players controlling roughly 70% of global capacity. RS Technologies is one of the industry’s leaders. The business model is predominantly service-based: ownership of the wafer remains with the customer, while RST generates revenue by providing reclaim services. Test and monitor (”dummy”) wafers remain an essential consumable for maintaining manufacturing yield regardless of end-market semiconductor demand.
▪️The wafer reclaim business is the company’s core segment, generating approximately 35% of revenue, 64% of operating profit (or roughly 75% excluding subsidies in the prime wafer segment), with operating margins in the high-thirties and ROIC above 20%. Both of the company’s key facilities (Japan and Taiwan) are currently operating at 100% utilization, running 24/7 across three shifts amid the AI-driven semiconductor boom. We expect segment revenue growth to accelerate from the current mid-teens to the high-twenties over the next several years, while operating profit could increase by approximately 77% between 2025 and 2028.
▪️Demand is being supported by two structural tailwinds. The first is the construction of new fabs: more than 60 semiconductor fabs are currently under construction worldwide, including 11 in Japan and 9 in Taiwan, while TSMC has raised its 2026 CapEx guidance to $60-64 billion. The second is the migration toward leading-edge process technologies. Reclaimed wafer consumption intensity increases by roughly 3-4x for the same fab capacity (according to industry experts, from approximately 40k reclaim cycles per 50k wafer starts at 28nm to roughly 115k at 3nm and 135k at 2nm). To meet this demand, RST is investing ¥52 billion (~$324.6 million) to expand total reclaim capacity to 1.19 million wafers per month by 2028 (+72%), with Taiwan representing the primary expansion focus.
▪️The prime wafer business (approximately 26% of revenue and 26% of operating profit) is entirely China-based and is consolidated through publicly listed GRITEK (688432 CH), in which RST holds an effective 39.1% economic interest. This business is capital-intensive, generates ROIC below 5%, and is only beginning to emerge from a prolonged industry downturn. Its long-term outlook remains mixed due to the structural transition from 200mm to 300mm wafers and aggressive pricing by Chinese competitors. However, GRITEK’s public listing makes the segment a key source of hidden value within the group.
▪️Based on our model, we expect group revenue to grow at a 15.3% CAGR through 2028, operating profit at 19.5% CAGR, and net income at 19.8% CAGR, driven primarily by the increasing contribution of the higher-margin reclaim business. We forecast net income to exceed management guidance by 5%, 19%, and 23% in 2026, 2027, and 2028, respectively (management’s previous medium-term forecasts also proved conservative). While we expect free cash flow to remain deeply negative during the investment cycle, net debt should remain negative even if the entire expansion program is financed with debt.
▪️Even after accounting for these risks, the valuation appears exceptionally attractive — both on conventional relative valuation metrics and on common sense. RST trades at a substantial discount to direct peers such as Phoenix Silicon (8028 TT), Kinik (1560 TT), and Scientech (3583 TT) despite offering comparable business quality and growth prospects. Moreover, RST’s 39.1% stake in publicly listed GRITEK alone was worth ~$2.9 billion as of July 29, while the entire market capitalization of RS Technologies stood at only ~$926.7 million. In other words, the market is effectively assigning a negative value to the company’s highly profitable and rapidly growing wafer reclaim business.
Since many of you seem to have the memory of a goldfish, here's how the hyperscaler capex → free cash flow cycle works as explained by Andy Jassy back in April. He's right.
Amazon: "We have customer commitments that make our capex investments predictable. We’re not investing approximately $200 billion in capex in 2026 on a hunch. The recent OpenAI commitment (over $100 billion) is an example of this, but there are several other customer agreements completed (and unannounced), or deep in process. Of the AWS capex we expect to spend in 2026, much of which will be monetized in 2027-2028, we already have customer commitments for a substantial portion of it.
We are willing to make large capex investments and endure short-term FCF headwinds for the substantial medium to long-term FCF surplus.
AI is a once-in-a-lifetime opportunity where the current growth is unprecedented and the future growth even bigger. AWS has a significant leadership position with the broadest functionality, strongest security and operational performance, largest share of customers and revenue, strong desire from customers to run their AI in AWS, and an opportunity to build what could be a new pillar for Amazon in chips.
We’re not going to be conservative in how we play this—we’re investing to be the meaningful leader, and our future business, operating income, and FCF will be much larger because of it."
📌GS: Japan Equities — Trigger Warnings (2024 Sell-off Replay Risk)
▪️July–Aug 2024: TOPIX fell -24% peak-to-trough (2,929 on 11 Jul → 2,227 on 5 Aug), triggered by USDJPY collapsing from ¥162 to ¥143 (-11%) over the same window. It took ~353 days to fully recover.
▪️Setup today is higher and more crowded: TOPIX and Nikkei sit +37% and +53% above 11 July 2024 levels. GS just raised its 12M TOPIX target to 4,500.
▪️GS Prime HF gross and net exposure to Japan are at the 99th and 98th percentile (5-year) — both above July 2024. Outstanding margin buys (mostly retail) are +35% higher than July 2024, and net foreign positioning is +20% higher.
▪️Positioning is jammed into a narrow AI/FX-sensitive trade: the Nikkei/TOPIX (NT) ratio hit an all-time high of 18x in June, and AI-related stocks now trade at nearly 2x the valuation of non-AI names.
▪️Sector dispersion in the 2024 crash was violent: Financials (ex-Banks) fell -31% vs Pharmaceuticals -12% — a 19ppt best-to-worst spread across TOPIX-17. TOPIX Banks rose +5% on BOJ hike day (31 Jul) then fell -27% by 5 Aug.
▪️Two triggers merged: BOJ hiked the policy rate from 0–0.1% to 0.25% on 31 Jul with hawkish guidance; US payrolls printed 114k in Jul vs 175k consensus on 2 Aug. The US2Y–JGB2Y spread compressed from ~450bps in early July to below 350bps by 5 Aug.
▪️The unwind was mechanical, not fundamental: risk-limit and stop-loss cascades (multi-strat drawdown limits as tight as -2.5% of deployed capital) drove an -18% two-day capitulation on 2–5 Aug — then TOPIX snapped back +23% from 5 Aug to 3 Sep.
▪️Pace matters more than level: when USDJPY fell a gradual -7% (¥158→¥147) from Jan–Mar 2025, TOPIX actually gained +5%. GS's FX team now sees USDJPY at 162/163/165 (3M/6M/12M), revised up from 160/158/155.
▪️Foreign flow whipsaw quantified: foreigners net-sold ~¥13tn of Japanese cash + futures from July 2024 to April 2025, then bought back ~¥14.8tn since April 2025 — leaving the same elevated positioning exposed again.
▪️Portfolio P&L math from the -24% drawdown: unhedged Long-Only -11% (yen translation cushioned it), FX-hedged Long-Only -24%, and a market-neutral L/S book with a Long-Exporters/Short-Domestics skew still lost -5% on deployed capital — enough to breach most multi-strat limits.
📌Goldman Sachs: Bending Spoons $BSP
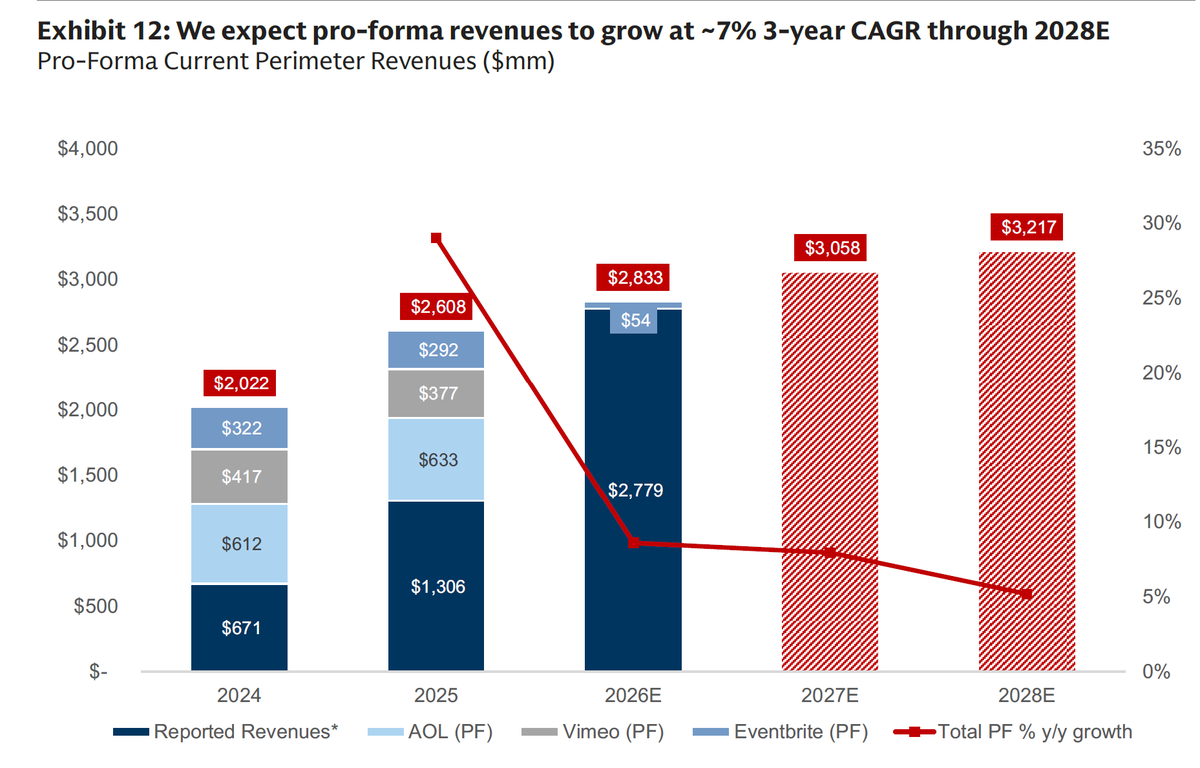
▪️Initiating with Buy and a 12m PT of $43 vs. $34.06 (+26.2%). BSP trades at just ~11.7x EV/GSe '27 Adj. EBIT vs. the ~13.0x peer group average — a growth consolidator priced like a mature marketplace.
▪️Revenue CAGR '26–'31 of ~36%, but organic is only ~7% over 3 years. Almost all growth is inorganic: the thesis hinges on executing future M&A, not on the existing portfolio.
▪️M&A revenue modeled to ramp from $121mn in 2026E to $9.90bn by 2031E (~69% 4-year CAGR), assuming two acquisitions per year through 2031.
▪️Adj. operating margin: 46.9% in 2025 → 52.5% in 2027E → 59.8% in 2031E. Expansion is driven by expense rationalization of acquired assets, not organic — underlying Current Perimeter margin adds only ~50–100bps/year after 2028.
▪️M&A Adj. EBIT: $35mn in 2026E (~29% margin) → $6.00bn in 2031E (~61% margin), ~81% 4-year CAGR. Progressively larger deals are the primary profit driver.
▪️~$24.5bn of cumulative acquisitions through 2031, funded by ~$15bn of new debt ($2–4bn/year). Gross leverage held at 2.5–4.5x (gross debt / TTM Adj. EBIT).
▪️Advertising: $67mn in 2025 → $289mn in 2026E (+329% YoY) on the AOL acquisition. Other: $26mn → $257mn (+889% YoY) on Eventbrite. Both segments then flatten to ~0% organic growth.
▪️1,000+ acquisition targets identified, ~$400bn aggregate 2025 revenue. Average deal size grew from $200mn (2023) to $953mn (2026 YTD); criteria target $50mn–$5bn revenue assets in Europe/North America.