Help improve how Madrid manages its green spaces and WIN prizes for €8000! Deadline for submitting your data analysis or visualization: 15 December 2020
Madrid green treasure, part 1 of 4.
It is a scrollytelling visualization realized by VizArt for the @greemtaEU, created by @FBK_research and promoted by @EITeu KIC’s Cross-KIC Sustainable Cities, about the social and economic values of trees and green in Madrid.
#dataviz#madrid
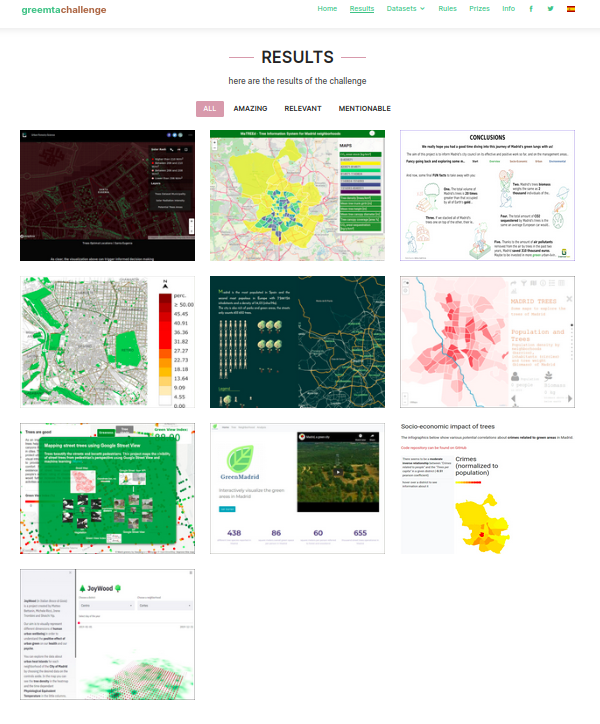
We're happy to announce we won the second prize in the @greemtaEU challenge 🏆
It was organized by @FBK_research under the @ClimateKIC's Cross-KIC Sustainable Cities initiative & aimed at improving the management of green areas in Madrid using open data:
https://t.co/YgLK3m03YR
Neat #dataviz to analyze NBA players by @Pivot_Analysis. Adding scatterplots would help to spot players with unusual correlations between any pair of metrics.
I used the same approach in the past when analyzing university rankings, and scatterplots facilitated the task!
Do you need some suggestions for a project to submit?
Check our "awesome green resource" list on github :)
https://t.co/PbgY8YT4X1
We are updating it day by day and any feedback is welcome
Analyzing correlation between happiness (based on twits) and proximity to green areas, as in the amazing work by @aschwartz@jarlathond@taylorhricketts)
could be a great contribution to #GreeMta challenge! https://t.co/s48BAnh0ec Deadline 15 December 2020, prizes = 8000 Euros
“Gauging the happiness benefit of US urban parks through Twitter”
Thread on our newest preprint led by @aschwartz w/@jarlathond & @taylorhricketts
https://t.co/WvYqvEFNR6
1/9
@cheeaun adapting your work on Singapore Trees to Madrid data would be a great contribution to the #GreeMta challenge and get a chance to win one of the prizes for up to 8000 Euros! Deadline 15 December 2020! https://t.co/tknWOYanjB https://t.co/0LGryM9s32
🚀 Re-introducing https://t.co/VgJLOeYyev 2.0🚀 https://t.co/EWoTDl3lBu
🥞 Whole new set of data, including relevant POIs
😎 High-quality mode for mostly desktop browsers with *all* trees loaded client-side *and* 3D mode
⚡️ 5X faster mouse hover info popovers
@Jill_hubley your "NYC Street #Trees by Species" work is amazing! Doing on the #Madrid trees data we have released would be a great contribution to the #GreeMta#challenge and maybe it could win one of #prizes for up to 8000 Euros! https://t.co/NYte2Zb8AA https://t.co/0LGryM9s32
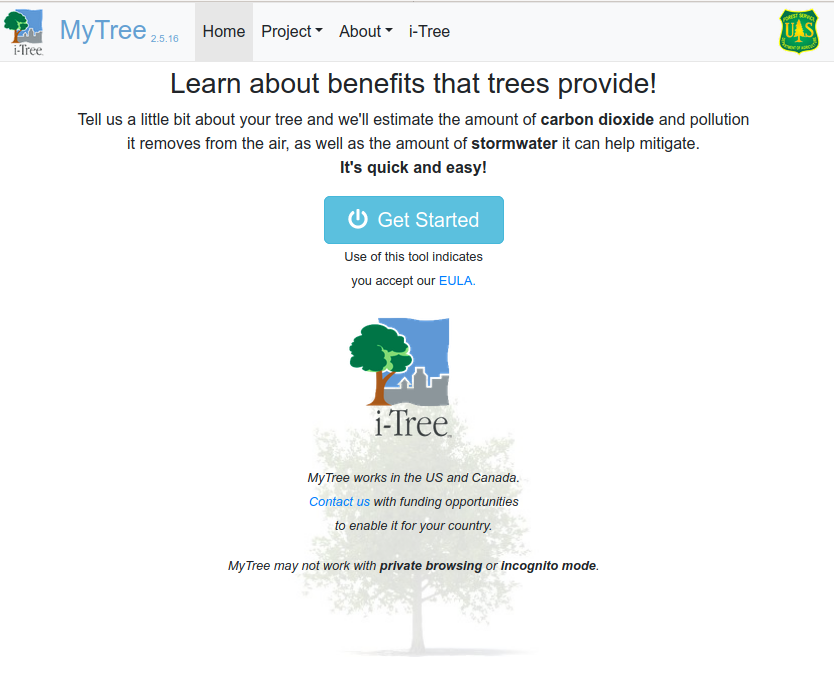
Learn about benefits that trees provide!
Tell us a little bit about your tree and we'll estimate the amount of carbon dioxide and pollution it removes from the air, as well as the amount of stormwater it can help mitigate.
It's quick and easy!
https://t.co/SiVBWKWrtV
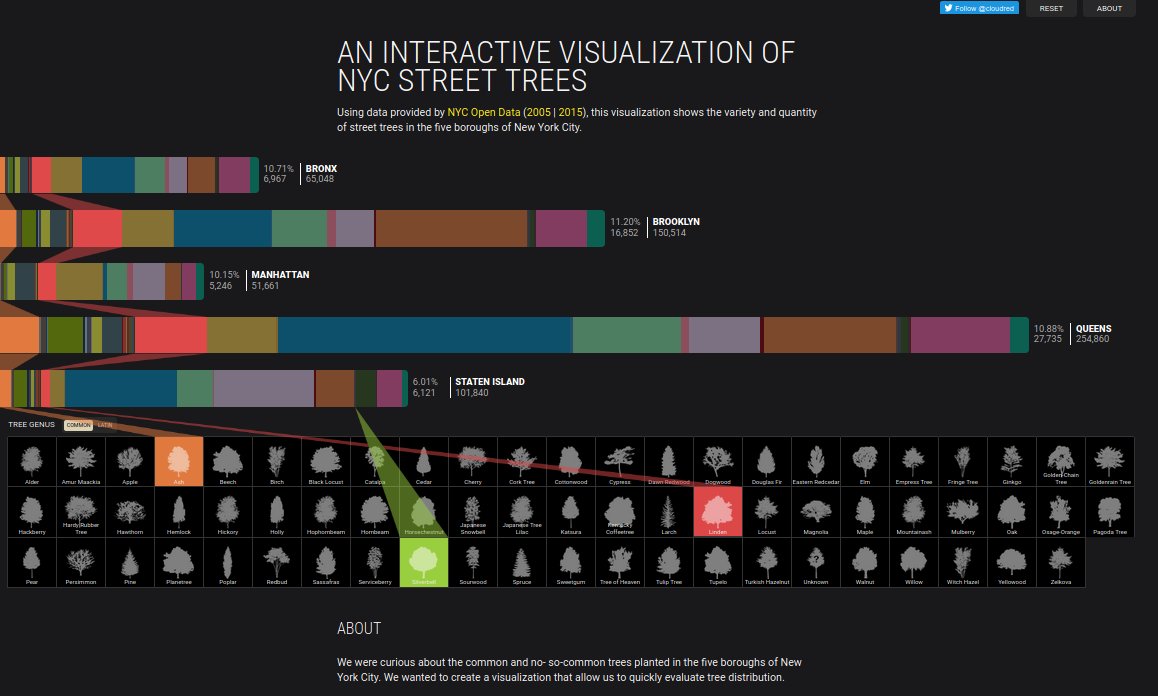
Did you see this amazing #dataviz about the #trees of New York made by @cloudred ?
https://t.co/W3leAvDjvi
This can be an amazing product to partecipate to our challenge with the trees of #Madrid :)
https://t.co/XJO7NvwTSl
#datascience#opendata