I asked ChatGPT to write a FASTA parser. It returned a fully working Python implementation with comments and everything. I asked it to port it to Rust. It did that, and produced a correct Rust program that compiles without any warnings. What is this sorcery??!
🔥3 free data science books, the most popular among our subscribers!
1. Fundamentals of Data Visualization by @ClausWilke
2. Python Data Science Handbook by @jakevdp
3. Hands-On Data Visualization by @HandsOnDataViz
Links⬇️
At @nanopore’s pathogen event - @laura_boykin urges the global #publichealth community to stop doing “labs in a suitcase” and colonial science, but instead focus on building local in country infrastructure and jobs. #ASMicrobe
Our article on preconception/preimplantation screening human embryos for pathogenic variants & mutations with #WGS https://t.co/jYiH3uA2lK #genome#genetics
Evolution is tree-like, but not a tree. This is why in pggb we make genome graphs without a guide tree. Looking for further support of this, including study targets (clades and species), to convince ever-skeptical grant reviewers of the importance of this https://t.co/Ccg1H59nbo
Mutational signatures extracted from more than 12000 tumor whole genomes from #100kGenomesProject, including common and rare signatures.
Great work by @SerenaNikZainal team!
https://t.co/RmFG8rCL1J
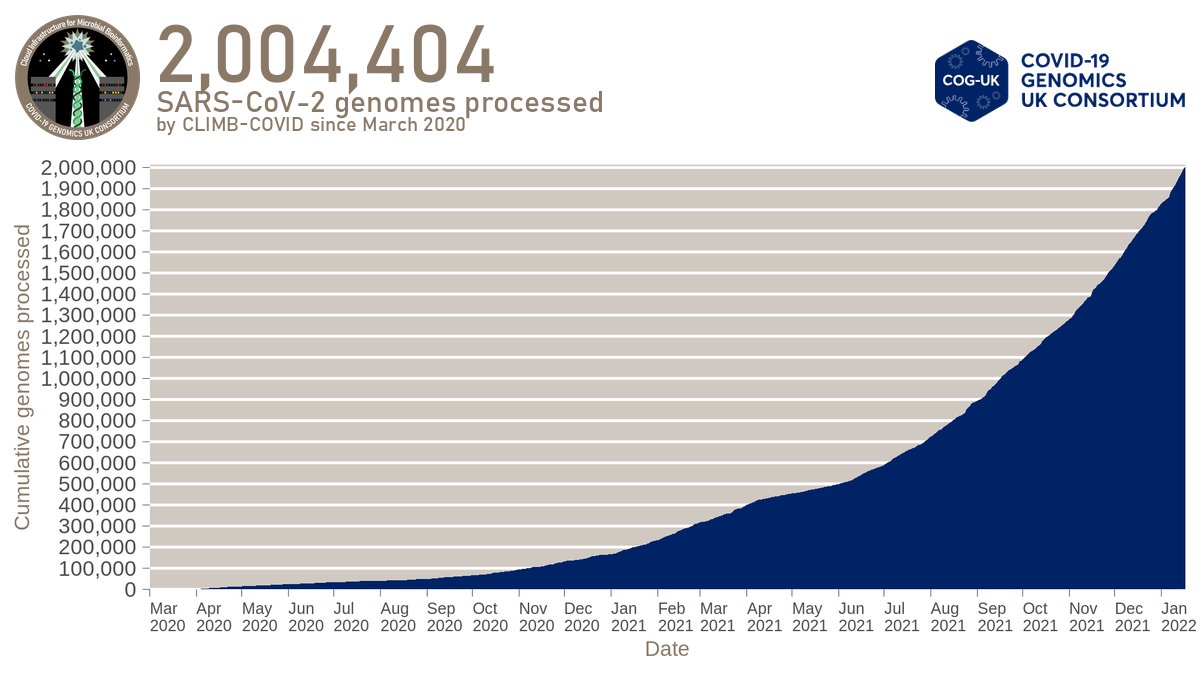
No less than four months since @MRCClimb's CLIMB-COVID pipelines reached the staggering and sombre milestone of 1 million genomes, we've done it all over again and the count now stands at over 2 million UK SARS-CoV-2 genomes🧵Thread on how our system works https://t.co/Bcg1HkTrcV
Bioinformatics (me paraphrasing: tools and methods) are 31-fold over-represented among the highest impact scientific papers of the past two decades https://t.co/pm8uubjhJE
Cumulative numbers diff age groups:
1⃣ Excess mortality (wk 50)
3⃣ C19-deaths, death certificates (wk35)
Since start vaccination campagne, in which 80+ and care home pop. got vaccinated first, 1⃣ did not increase for long time. Among 65-80 yes, but 1⃣ = 3⃣ during that period.
3 types of mortality data per week in 1 graph:
1⃣ Excess mortality (EM, wk50)
2⃣ Reported deaths of C19 patients (wk 50)
3⃣ C19-deaths based on death certificates (wk35)
Untill now 3⃣ as high or much higher than 1⃣ or2⃣.
Recently, 1⃣ is really much higher than 2⃣.
3⃣ Statistics Netherlands published Cause of Death statistics, based on info of medical doctors. CBS publishes figures on this since 1899. The C19 outbreak presented CBS with a challenge that had not arisen since the Spanish flu. Explainer:
https://t.co/FZgx6y3GFJ
💡May be of interest for non-Dutch: a short explainer on the 3 sources of mortality data in the Netherlands🇳🇱.
1⃣ Total and excess mortality
2⃣ Reported deaths of C19 patients
3⃣ C19-deaths based on death certificates (filled in by MD)
@statisticscbs@GGDGHORNL@rivm
/Start 🧵
Our new variant technical briefing contains updated analysis on Omicron hospitalisation risk and vaccine efficacy against symptomatic disease and hospitalisation: https://t.co/254m2rwJN5