Now that the DOJ is investigating potential irregularities in the valuations of private credit funds (such as “100-to-81 overnight”), I predict the next reported valuations across the industry will show “adjustments” to the downside.
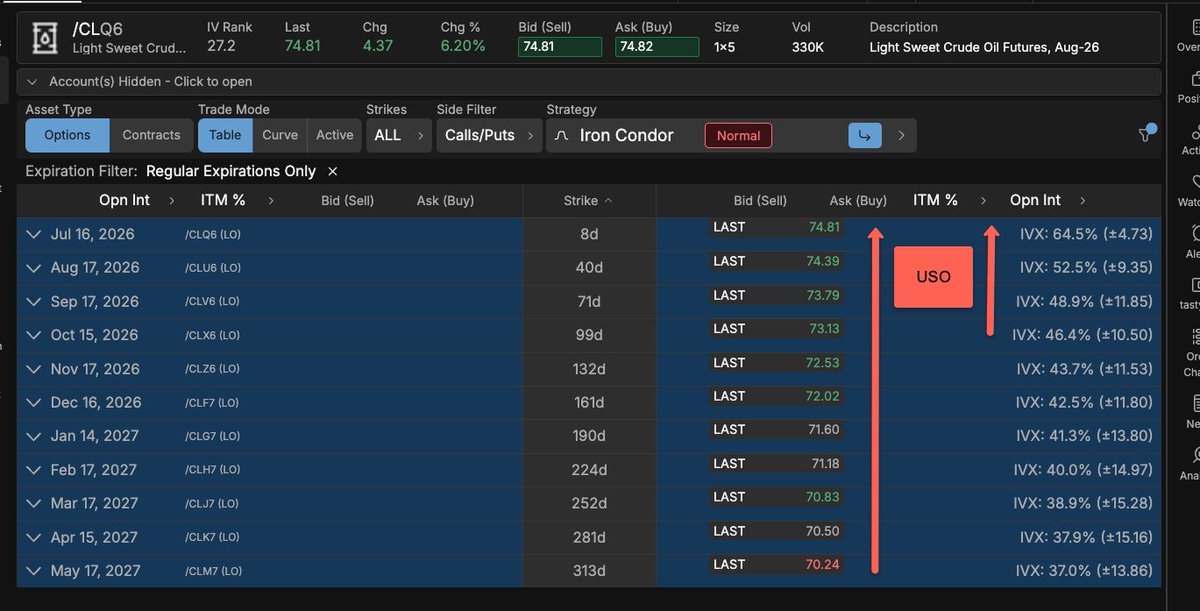
My favorite ticker right now for a bullish continuation might be $USO - it's a good lesson in how quickly this fund can rip to the upside when /CL futures go into backwardation - the more the crude oil futures are backwardated, the more $USO has the ability to rip higher as they rebalance into further out, less expensive contracts - we were below $70 before the war with a pretty flat curve, and spiked to $150 at the height of $15 backwardation in /CL - I got back in with a +SEP/-AUG diagonal spread to keep it small and defined risk, but if we see /CL rise and backwardation steepen (pretty flat now, but $4 from front to back), that's a big bullish recipe for $USO similar to $VXX / $UVXY when /VX is in backwardation:
We’ve been quiet.
A major upgrade is coming to OptionsDepth.
🥁 Introducing IV Depth 🥁
5 new modules built to track how the volatility surface shifts—in depth.
Available tomorrow, July 9th.
$SPCX crashed right after its IPO to $147.
It's going under $100 first before ripping $1,000+
These 19 SPACE stocks will explode too:
1. $RKLB ~$87
Small-launch and satellite manufacturing filling the gaps Falcon can't serve efficiently.
2. $GILT ~$13
Satellite ground infrastructure scaling alongside enterprise and constellation broadband deployments.
3. $TWST ~$89
Synthetic DNA tools underpinning long-term space biology and life-support research.
4. $OUST ~$44
Digital lidar enabling autonomous docking, landing, and robotic space operations.
5. $ASTS ~$75
Direct-to-phone satellite broadband. Starlink's closest competitor and launch partner.
6. $POET ~$8.50
Photonic optical engines powering high-speed links across satellite and AI networks.
7. $BWXT ~$189
Nuclear propulsion and reactor tech aligned with deep-space and Mars power needs.
8. $SPIR ~$16
Space-based data analytics monetizing a growing orbital sensing constellation.
9. $IONQ ~$45
Quantum compute and quantum-secure comms expanding into orbital and defense applications.
10. $SATL ~$5
High-resolution Earth-observation imagery delivered cheaply through vertically integrated satellites.
11. $KTOS ~$50
Defense drones, propulsion, and satellite ground systems powering national security space.
12. $BKSY ~$25
AI-enabled Earth-observation satellites delivering real-time geospatial intelligence to governments.
13. $AEVA ~$24
FMCW lidar enabling precision sensing for landing, docking, and autonomy.
14. $MTSI ~$390
RF and photonic semiconductors powering satellite antennas and signal processing.
15. $ARQQ ~$20
Quantum-safe encryption securing government and classified orbital networks.
16. $LUNR ~$17.50
NASA lunar landers and cislunar infrastructure anchoring the emerging Moon economy.
17. $RDDT ~$193
Social data licensed for AI training adjacent to the Musk ecosystem.
18. $VIAV ~$47
Optical networking and test components critical for satellite ground-station upgrades.
19. $ACHR ~$5
eVTOL air-mobility networks integrating with low-latency satellite infrastructure.
♻️ RESHARE this post and write 1 comment, I'll share my favorite play for you! I called it out at $2!
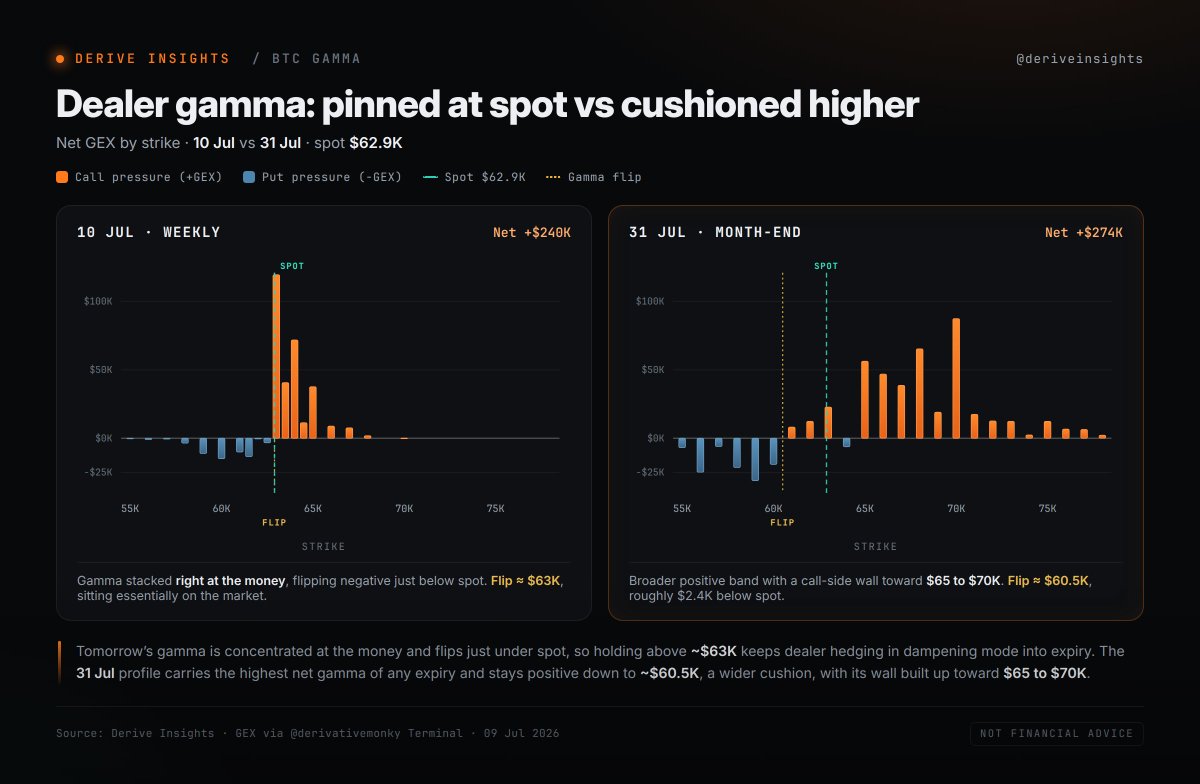
$BTC options: two expiries worth watching this month 📆
Tomorrow's weekly holds ~42K contracts. Month-end (31 Jul) holds ~137K, about 3.2x more.
The weeklies all max-pain near spot ($62-63K). 31 Jul sits higher at $70K (~11% above), and leans more two-sided (P/C Ratio at 0.91 vs 0.78 tomorrow).
31 Jul also carries the highest net gamma of any expiry (~$274K), concentrated $65-70K, lining up with that $70K max pain.
Nearer term, 10 Jul's gamma flip sits right around spot (~$63K). Hold above and dealers dampen; lose it and the cushion thins fast.
Data by: @derivativemonky Terminal
Text & Analysis by: @moritzpike
META stock has ripped over 10% quickly and vol is catching a bid. We are capped at a short term call wall, but there are big strikes up at 750 for Jan27.
We also have a downtrend resistance ~650, so I'd expect the stock to calm down on the upside for now without major bullish news flow.
The vol bid suggests that the street doesn't own much vol as we rally and so that means instability is likely in this name in either direction.
Maturity is a leverage slider for options.
On a short time frame, the option return ≈ spot return x Ω.
Ω = Δ·S / C, i.e. delta x spot divided by premium, aka 'omega'.
As the chart shows:
• Ω amplifies the spot move
• Ω is higher for short maturities
Explanation.
For an ATM option, premium scales roughly with σ√T while delta sits near 0.5, so cutting maturity shrinks the denominator without shrinking the numerator. The second factor is gamma: for short-dated options, the delta changes more for a given price move. Therefore, short-dated options are more convex.
The challenge is that, empirically, front-end implied vol tends to be more overpriced. You usually pay too much in theta for the gamma you get.
That said, the simple fact remains that if you're right on direction and timing, short-dated options give higher returns. Delta is king. It dominates vega and gamma-theta. And the option does not charge you for delta, only for vol.
Retail buys puts before earnings. Hedge funds buy put flies. Here's the gap.
Outright put: you're long vol. Vol gets smashed on the print. Even if the stock drops 5%, the vol crush eats most of your gain. The put goes up on delta and down on vega. The two cancel.
Put fly: you're long one put closer to spot, short two puts at your target zone, long one put below. You're net short vol on the structure. When vol gets smashed on earnings, the structure benefits from the crush instead of fighting it.
Roughly. On a typical earnings, an outright put might cost you a few percent of stock notional. A well-built put fly costs a fraction of that. If the stock lands inside your target zone, the structure is built to pay multiples of the debit. If the stock blasts through, the fly caps your gain and the outright put pays more.
So the question isn't "which is better." It's "what's the trade?"
If you think the move will be roughly the implied move and you have a target zone, the fly. If you think the move will be 2x implied and you don't know where it lands, the put.
Most earnings moves are inside or near implied. That's why the fly wins more often. The vol reset works for it instead of against it.
That's the structural edge of the fly and why it's one of my preferred earnings trade expressions.
𝗟𝗲𝘁 𝗺𝗲 𝗿𝗲𝗽𝗲𝗮𝘁 𝘁𝗵𝗶𝘀 𝗽𝗼𝗶𝗻𝘁: 𝗧𝗵𝗲 𝗯𝗲𝘀𝘁 𝗯𝘂𝘆 𝘀𝗶𝗴𝗻𝗮𝗹 𝗶𝗻 𝗺𝗮𝗿𝗸𝗲𝘁𝘀 𝗶𝘀𝗻'𝘁 𝗼𝗻 𝘁𝗵𝗲 𝗽𝗿𝗶𝗰𝗲 𝗰𝗵𝗮𝗿𝘁.
When spot makes a new low and VIX refuses to make a new high, pay attention. That's a vol divergence. The options market is quietly telling you it doesn't believe the selloff has legs.
But most traders miss it because they're staring at candlesticks.
Here's how to read it properly. Pull up fixed strike vol on the front of the curve. If the market is selling off hard and fixed strike vol is flat or drifting lower, that's your tell. The people who price risk for a living are saying "we're not buying fresh protection here."
Think about what that means. If vol can't rally when the market is getting destroyed, what happens when spot bounces even 1%?
Vol gets annihilated.
So the real trade here is selling the vol that can't go up. Different expression, completely different risk profile, and way better risk-reward than just buying the dip. When you learn to trade in more than just the spot dimension, you find edge in other areas like VEGA.
FedResearch
@FedResearch
When term premiums go up, banks lend MORE. We formalize this in a dynamic bank portfolio model & test it using the 2013 Taper Tantrum.
Finding: QE's term premium compression may dampen bank lending, working against monetary policy stimulus goals.
https://t.co/V9woAZivEJ
----------------------------
This is demonstratively wrong -- US GDP growth (lagged 3Q) actually prime moves Bank Loan portfolio growth.
Rising 10Yr Term premium precedes Bank Loan portfolio declines.
been working on something dope for quite some time & I'm excited announce the launch of our crypto options analytics platform :
https://t.co/u0lmtU5fUu
No Login or Payment Required. It's completely free to use!
will explain in tweets below what it does below & how it works👇
📈 The share of supply held by LTH keeps climbing as STH keep holding.
Today we have ~ 15.6 million BTC held by these investors, roughly 78% of circulating supply.
In December 2023 we had ~16.8 million.
We can see just how much they’ve impacted the market and marked the different tops of this cycle by distributing large amounts of BTC.
💡 Keep in mind that the current increase means these BTC were bought 6 months ago, when price was trading around $90,000.
I wouldn’t be surprised to see a clear increase in August, since that would capture the drop below $60,000 from early February, and we’ll see here whether that drop actually stirred up demand.
One last interesting point, we can also see that LTH supply share rose sharply between the end of the bear market and the first top before entering these distribution cycles.
🔄 The handoff is clearly visible, and this cycle was no exception whatsoever.
⚠️ Be careful, I’m seeing a lot of misreadings of this chart, with some people claiming LTH are accumulating.
These charts are UTXO-based models, meaning that for a BTC to be counted as LTH, it must have been held for 6 months prior.
So this chart can’t be used to illustrate LTH buying.
👉 Right now, what we can say is that more BTC held is transitioning into LTH status than is being sold off by these participants.
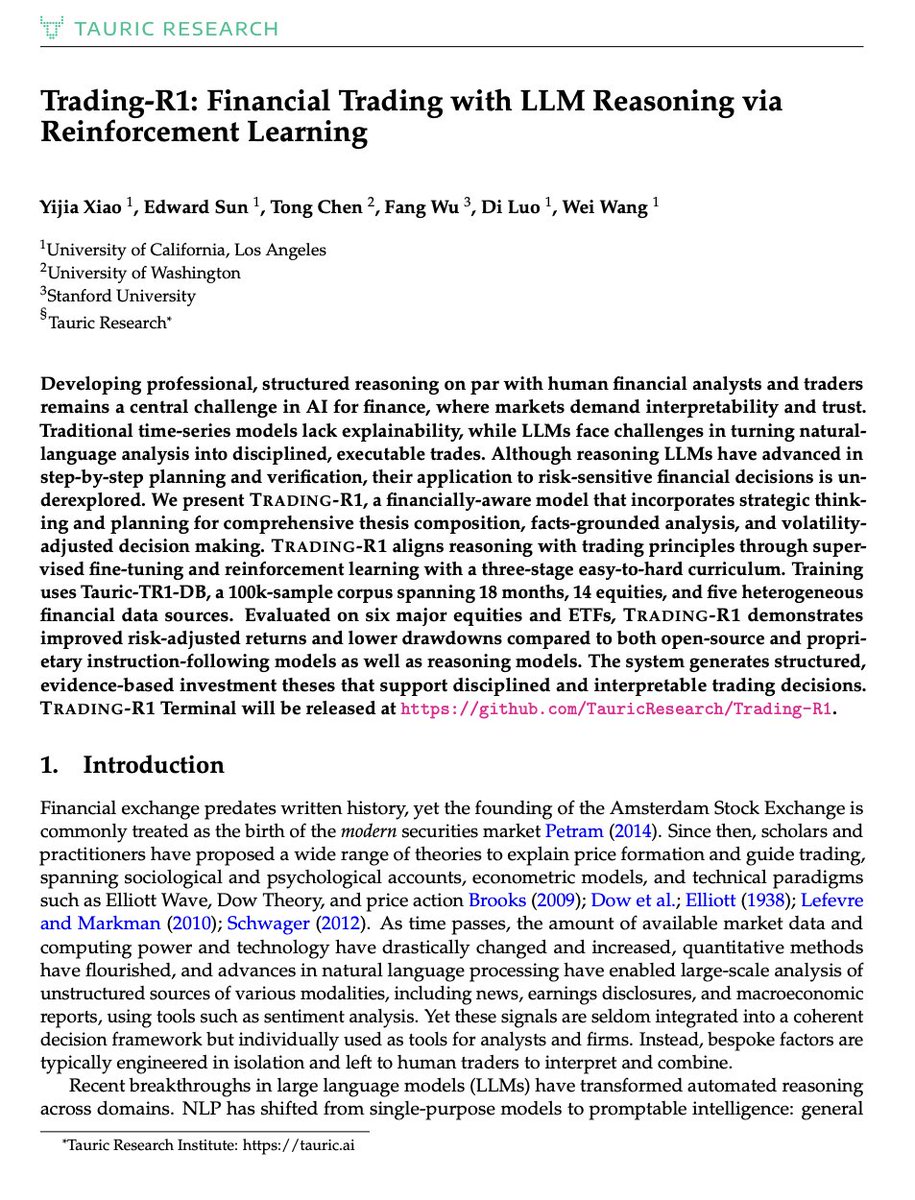
This paper completely changed how I think about specializing LLMs for trading:
Multimodal data -> Volatility labeling -> Structure -> Claims -> Decision
Here is the 5-step blueprint for training a trading LLM:
Multimodal data: collect 100k samples across 14 blue chips over 18 months from five channels - prices and technical indicators, news, fundamentals, insider sentiment, macro.
Volatility labeling: build a composite signal from EMA returns over 3, 7 and 15 day horizons normalized by rolling 20-day volatility, then project onto five classes Strong Sell / Sell / Hold / Buy / Strong Buy.
Structure (Stage I): supervised fine-tuning plus RFT on section organization (fundamentals, technicals, sentiment) so the model learns to reason like an analyst.
Claims (Stage II): RFT on an opinion-quote-source scheme per bullet so every claim is anchored to a citation from the input data and hallucinations drop.
Decision (Stage III): RFT with an asymmetric reward matrix that penalizes false bullish signals about 12% harder than false bearish ones, reflecting how fast markets fall and the priority of capital preservation.
Key insight: reasoning-tuned LLMs (o3-mini, o4-mini, DeepSeek) lose to plain LLMs on trading because their reasoning drifts away from financial data.
In the held-out June-August 2024 window Trading-R1 at 4B parameters hits a Sharpe of 1.80 on AAPL, while OpenAI's o4-mini reaches a Sharpe of -1.36 on the same ticker.
Read this, then check the article below.
Leveraged ETFs rebalance every day.
After a strong up day, they often need to buy more to restore their target leverage. After a down day, they typically sell more.
That daily rebalancing can amplify market moves and increase volatility, especially into the close.
$WGS hits $70, up 75% in just two months since I named it my highest conviction pick.
In my view, it’s the biggest AI beneficiary in genomics, yet it’s still down 45% YTD. There’s still plenty of room to run.
When a theme catches fire in this market, it tends to get really hot.
TOP 7 GAMMA SQUEEZE IDEAS for June 28-July3
1. $MU calls July 17 $1500 (expensive)
Trigger: post-blowout Q3 earnings (June 24) digestion, HBM4/Vera Rubin supply headlines.
Pre-squeeze signal: IV staying elevated after the +20% earnings gap instead of crushing call OI building above the $1200 area.
Fuel: extreme realized vol (beta 3+) + heavy retail options flow chasing the AI-memory narrative, not short covering this is a momentum/gamma-chase, not a short squeeze.
2. $NBIS calls July 10 $260
Trigger: Nasdaq-100 inclusion (effective June 22) still forcing passive/index-fund buying.
Pre-squeeze signal: call skew building above spot + unusual volume on down days, a sign dealers are still net short gamma into the rebalance flow.
Fuel: forced index-fund buying stacked on top of dealer hedging — real mechanical bid, not short-interest driven.
3. $OUST calls July 17 $50
Trigger: REV8 lidar contract cadence (AIM Intelligent Machines, Benchmark mfg expansion, BlueCity DOT deals).
Pre-squeeze signal: call volume spiking on each contract headline + heavy insider selling not denting the bid a sign retail/options flow is overpowering supply.
Fuel: small float + story-stock momentum chasing headline-driven contract news, classic low-cap gamma-chase setup.
4. $TSLA calls July 17 $420
Trigger: robotaxi geofence expansion + Q2 delivery number due in early July.
Pre-squeeze signal: elevated realized vol clustering around binary events, call OI piling up just above spot ahead of the delivery print.
Fuel: massive options gamma and Musk-driven retail flow TSLA moves on dealer hedging around events, not short-interest mechanics; short interest here is unremarkable for a name this size.
5. $NOW calls Aug 21 $110
Trigger: violent oversold bounce (down from $139 to $90, now reclaiming $97+) on IBM/HPE/Google AI partnership news.
Pre-squeeze signal: call buying into the bounce off the $90 low + analyst target hikes (Benchmark to $130) widening the gap to spot.
Fuel: large float, low short interest this is a mean reversion/oversold-bounce trade, not a squeeze. Treat as IV expansion on a violent reversal.
6. $MSFT calls July 17 $400
Trigger: Michael Burry's disclosed long-dated LEAP call position (June 25) + AI-software rotation out of chip names.
Pre-squeeze signal: the +5.7% single-day reversal off the year's deepest drawdown, with volume confirming real buying, not just a short-covering pop.
Fuel: none of the squeeze mechanics mega-cap, low short interest. This is sentiment/rotation-driven, with the next real catalyst being the FQ4 print in mid-to-late July.
7. $GOOG calls Sep 18 $400
Trigger: TPU/AI-capex leadership narrative reasserting itself this week despite Gemini-team departures.
Pre-squeeze signal: stock holding the $334-345 range on elevated volume (82M vs 28M avg) despite negative talent-loss headlines absorption, not capitulation.
Fuel: mega-cap, low short interest, no squeeze mechanics this is a capex/AI-leadership re-rating story, watch the $340 area as a confirmation level.
NOTE: This will only work if $SPY holds up this week Mag 7 softness + Hormuz/oil headlines could pressure the whole tape. JULY is the bullish month right now for seasonality so expect fireworks.