Before the PAT Explosion: How to Spot an Earnings Turnaround Early
Morepen Laboratories was showing the clues months before the numbers exploded.
Morepen Laboratories' stock rose 112% in just six weeks, reaching ₹112.85 by September 2, 2026.
Then came the numbers:
Revenue: +34%
EBITDA: +207%
PAT: +394%
Export revenue: +111%
But here's the interesting question:
Could the changing business story have been identified before the earnings explosion?
Not by predicting the stock price.
By following the clues.
1) The first clue: Something changed in the business model
In February 2026, Morepen disclosed a ₹825 crore multi-year CDMO mandate from a leading global pharma company.
CDMO = Contract Development & Manufacturing Organisation.
This wasn't just another order.
It potentially changed the earnings architecture of the business:
one-off/shorter-cycle manufacturing → longer-duration customer programmes → greater revenue visibility → better utilisation → operating leverage
But an order alone proves nothing.
The next question was:
Can the company actually execute it?
2) Capacity is the bridge between an opportunity and revenue
Morepen had a production base of roughly 500 KL.
The company outlined:
→ ~800 KL expansion
→ ~1,000 KL longer-term capacity
This is where investors need to be careful.
Capacity expansion by itself is not a bullish signal.
A company can build capacity and still struggle to fill it.
The stronger signal is:
Capacity + visible demand + customer validation + rising utilisation
That's a very different proposition.
3) Then came an important confirmation: FY26/Q4
By May 2026, the financial results were already beginning to show improvement.
Q4 FY26:
→ Revenue +22% YoY
→ API growth +17%
→ Medical Devices growth +31%
At the same time, the CDMO programme had progressed:
→ Audits completed
→ Validation batches completed
→ Commercial production commenced
→ Phased supply schedule received
This is an important investing lesson:
Don't wait for the spectacular quarterly number to start investigating the story.
Often, the operational evidence appears first.
4) Look for more than one growth engine
Another clue was easy to miss.
Morepen wasn't relying entirely on CDMO.
There were at least three potential growth engines developing:
API
Recovery in the core API business.
Medical Devices
A separate growth engine, with Q4 growth of 31%.
CDMO
A newer, potentially longer-duration manufacturing opportunity.
Why does this matter?
Because a turnaround becomes more interesting when improvement isn't dependent on one single assumption.
You want to understand:
Where can the next ₹100 of revenue come from?
5) Then look at exports — but look at the change, not just the headline
This is where the analysis gets more nuanced.
FY26 exports were approximately:
₹650.7 crore vs ₹664.0 crore
So it would have been wrong to say:
"Exports were already booming."
They weren't.
But the investor should have been watching for acceleration.
And that acceleration arrived in Q1 FY27:
→ Export revenue +111% YoY
→ API exports +42%
The lesson:
Don't only compare annual numbers.
Look for the point at which the direction and rate of change begin to shift.
6) The CDMO story then moved from promise → validation
This is probably one of the most important clues.
The company had moved beyond:
"We have won a large mandate."
to:
"We have completed validation and started commercial production."
Then, on July 1:
~₹50 crore of first commercial dispatches under the ₹825 crore mandate had already been completed.
The company indicated another ~₹225 crore of supplies expected in Q2 FY27, subject to customer schedules and regulatory/commercial requirements.
This is the difference between:
an announcement
and
commercial execution.
7) Regulatory progress is another clue investors often underestimate
Morepen reported its fourth consecutive USFDA inspection with NIL Form 483 observations.
It also had EDQM approval for its Baddi facility.
But don't treat regulatory approval as an automatic earnings trigger.
Ask:
What commercial opportunity does this regulatory milestone unlock?
Regulatory credibility can matter because it can support access to:
→ regulated markets
→ global customers
→ higher-value APIs
→ CDMO programmes
The important connection is:
Regulatory progress → customer qualification → commercial opportunity
8) Then came the moment when the clues became visible in the P&L
Q1 FY27.
Revenue:
₹575 crore | +34%
EBITDA:
₹87.7 crore | +207%
EBITDA margin:
15.25% vs 6.65%
PAT:
₹56.35 crore | +394%
Exports:
+111%
API:
+31%
Medical Devices:
+19%
CDMO:
₹58 crore of commercial dispatches
Suddenly, the story looked obvious.
But it wasn't obvious six months earlier.
That's precisely the point.
9) Why did EBITDA grow 207% when revenue grew only 34%?
This is where investors should go beyond headline growth.
The concept is: Operating leverage
When revenue increases, some operating costs don't increase proportionately.
So incremental revenue can generate disproportionately higher incremental profit.
One simple metric to track:
Incremental EBITDA margin
= Change in EBITDA ÷ Change in Revenue
If this starts expanding meaningfully, ask:
→ Is utilisation increasing?
→ Is product mix improving?
→ Are fixed costs being absorbed over a larger revenue base?
→ Is the business moving toward higher-value products?
This can reveal the economics of a turnaround before simply looking at PAT growth.
10) But PAT is still not the final confirmation
A turnaround isn't complete because PAT has exploded.
The next question is:
"Where is the cash?"
Follow the chain:
PAT → CFO → Free Cash Flow
And monitor:
→ Receivables
→ Inventory
→ Working capital
→ Capex
→ Debt
For FY26, Morepen's reported receivable days were around 66 days and debt-equity was 0.17 vs 0.09 a year earlier.
So the balance sheet also needed to be monitored as the business scaled.
A company can report strong profits while cash gets trapped in working capital.
Cash flow is the reality check.
11) And finally: valuation
This is where many turnaround analyses go wrong.
Finding a potentially improving business is only half the job.
You still have to ask:
How much of the future improvement is already reflected in the stock price?
A company can deliver:
→ higher revenue
→ higher EBITDA
→ higher PAT
→ better cash flows
…and still offer limited upside if expectations have already moved too far ahead.
Therefore: Business turnaround ≠ automatic investment opportunity.
The final step is always:
Earnings potential + quality of earnings + balance sheet + valuation
12) The entire Morepen framework can be reduced to one chain
When studying a potential turnaround, don't jump straight to:
"Will EPS grow?"
Build the chain:
Strategy
↓
Customer
↓
Capacity
↓
Validation
↓
Commercialisation
↓
Multiple growth engines
↓
Revenue acceleration
↓
Operating leverage
↓
PAT growth
↓
Cash flow
↓
Valuation
This is much more powerful than simply screening for:
PAT growth > 25%
because by then, the turnaround may already be visible in the financial statements.
13) The key insight
The spectacular number is usually the end of a process.
Before revenue accelerates, there may be:
orders
Before orders become revenue:
customer validation
Before customer validation becomes commercial production:
capacity + regulatory readiness
Before PAT explodes:
utilisation + operating leverage
Before the market fully appreciates the change:
the clues
The skill is learning to connect them.
14) A practical turnaround checklist for retail investors
When you find a company with weak/normal historical earnings but a potentially changing story, ask:
Business
□ Has the business model changed?
□ Is there a new product/customer/geography?
Demand
□ Is there customer validation?
□ Are orders actually converting into supplies?
Capacity
□ Is capacity being added?
□ More importantly, is there visible demand for that capacity?
Execution
□ Have validation batches/commercial production started?
□ Are deliveries actually happening?
Growth
□ Is the core business recovering?
□ Is there a second/third growth engine?
Exports
□ Is export growth accelerating?
□ Is the company entering regulated markets?
Margins
□ Is incremental EBITDA margin improving?
□ Is product mix changing?
Cash
□ Is PAT converting into CFO?
□ Are receivables/inventory under control?
Balance sheet
□ Is debt rising faster than operating cash generation?
Valuation
□ What earnings are already priced in?
15) The biggest mistake investors make
They look at the stock chart and then search for a reason.
The better process is the reverse:
Study the business first.
Look for changes in:
→ customers
→ contracts
→ capacity
→ utilisation
→ regulatory approvals
→ exports
→ product mix
→ margins
→ cash flow
Then see whether the financial statements are beginning to confirm the story.
And only after that:
look at valuation.
16) Morepen is therefore not the conclusion.
It is the case study.
The purpose isn't to say:
"Morepen went up 112%, therefore this is how to find the next multibagger."
That's hindsight.
The more useful lesson is:
What information was available before the earnings explosion, and what did that information tell us about the changing economics of the business?
That is a repeatable research skill.
17) The mental model I would keep
Don't search for the company whose PAT has already exploded.
Search for the company where the conditions for PAT expansion are beginning to appear.
Look for the transition:
Narrative → Evidence → Execution → Financial confirmation → Cash-flow confirmation → Valuation
The earlier stages require more investigation.
The later stages are easier to see.
And that is exactly why they are often more obvious to everyone.
18) Final thought
The market eventually sees the flower.
The better fundamental investor learns to look for the seed.
Not every seed becomes a tree.
Not every turnaround succeeds.
But if you learn to identify:
customer validation + capacity + commercialisation + multiple growth engines + operating leverage + cash-flow improvement
you are no longer simply reacting to earnings.
You're learning to read the business before the numbers become spectacular.
That's the real Morepen lesson.
This is an educational framework, not a recommendation to buy or sell Morepen Laboratories or any other security. Turnarounds carry significant execution, regulatory, balance-sheet and valuation risks.
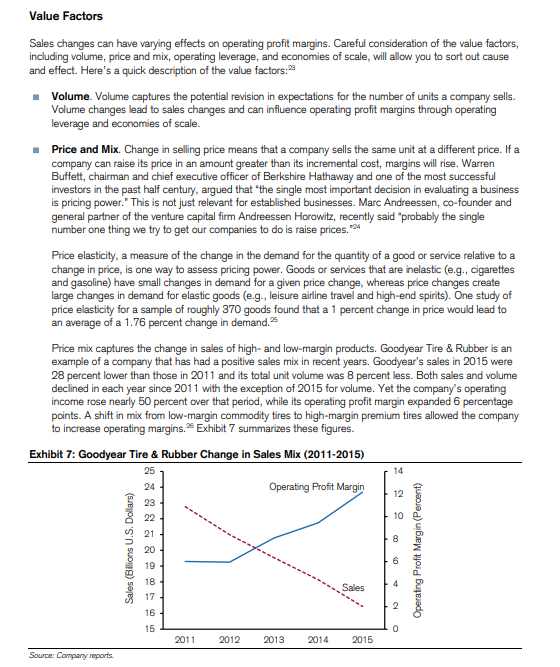
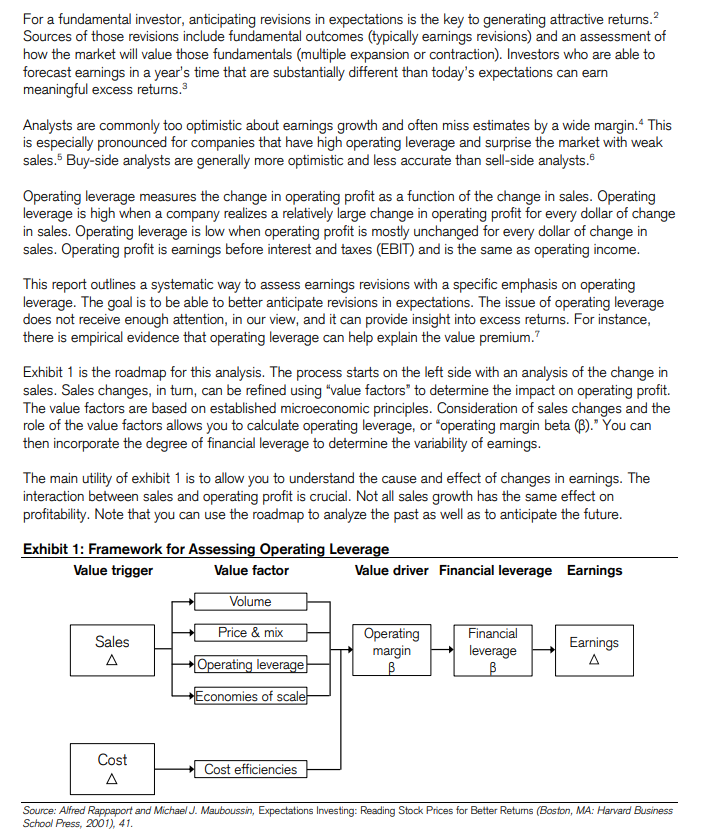
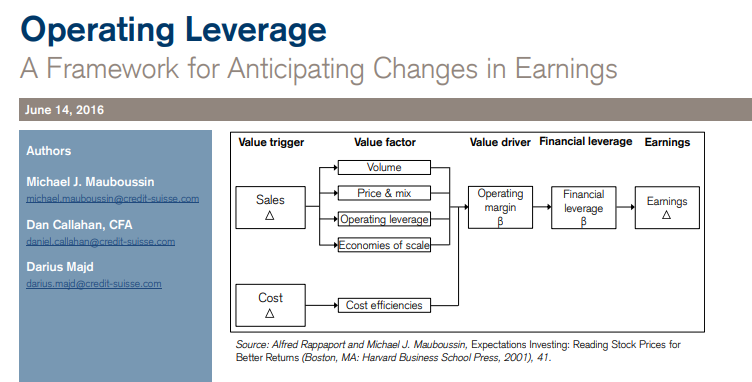
"Operating Leverage" (Mauboussin)
I would tell my 23 year old self, "spend the next 6-12 months on this topic and nothing else, until u have become fluent in this math."
1/6
fluency may be overstating it, there are just odd exponential effects at work here that are hard for our brains to grasp
sort of like compound interest, we just have a very hard time with non-linear growth rates, and here, u have many of them colliding with one another
the core math:
rev dollars split into px/vol, how those flow thru various cost structures (fixed vs. variable), incremental margins + quickly triangulating $1 of revs --> how many cents of ebit --> how many cents of eps
and then layer financial leverage onto operating leverage -- the way a chg in EBITDA affects equity value on a net cash B/S vs a 4x levered one
study all this until the dots start to align, its way more important than twtr celebrity gossip
"ooo leopolds wedding...ooo down to $10B AUM" like dog what sorority kitchen is this
but the combo of op lvg + fin lvg, the lollapalooza effect, is prob the most important shit to understand tbh in all of L/S equity
there's always spare $$ laying around, its always mismodeled, there's a sustainable source of edge in unit economics + fixed cost absorption + the fact that most equity guys don't really understand cap structure
2.
because op lvg + financial leverage...sales growth of 4% vs 5% can knock 1/3rd off the mkt cap in a highly-levered + high DOL cost structure
1% revs --> 10% EBITDA --> 15% EPS...capitalize the lost EBITDA @ 8x or wherever it trades, to get the delta in EV, and remember that the debt burden doesn't change...the mkt cap does.
say $250m debt + $250m equity = total capitalization
the lost EBITDA @ 8x, say $125m of EV
that $250m of debt is still $250m...those r contractual claims, they dont move with earnings, equity is residual and equity is guaranteed nada
so that $125m in EV comes right off the $250m in mkt cap.
bang, 50% equity decline
3.
u learn this shit by building a billion models and just tinkering with px/vol + cogs/opex items, and watching what happens to ebit and eps
lots of consumer, industrials, tmt, this is the math ur doing
a cruise ship, an airline, a semiconductor co, Mattress Firm...almost all these costs are fixed, the "factory" must run regardless of units moved
and u add in that these are cyclical as fuck, so u have a 3x lollapalooza at econonomic inflection points
sales up 20%, costs stay the same, ebitda up 50%, EPS 60%, levered out the ass so the levered equity stub 2-3x's in a month
so if I was coaching my 23 year old self, I'd say pull up 4 LLMs, chatgpt, claude, grok, gemini, and make ur way thru this mauboussin piece line by line, hitting LLMs until u understand everything
4.
and then after that, build 10 models of the nastiest high-fixed cost businesses u can think of, historicals going back 20 years, and study the way the quarterly P&L shifts around cyclical peaks and troughs
do a few shitco retailers, a casino, a hotel, an iron ore smelter, an offshore driller, a theme park, and hell, u may as well throw in micron
"why does this trade at 5x eps"
bro what do u think these companies do lol
"AI technology"
no. they make widgets
these are all widget companies
go stare at the quarterly P&L from 3-4 years ago, and ask grok if its good when u print a negative 30% gross margin
and then study what happens when negative gross profit dollars hit a fixed cost base
good intro to operating deleverage
5.
u know u are in high DOL shitco paradise when ur just staring at a P&L, like, "how did sales go down 5% and EPS went from $2 dollars to negative $12?"
but I'm saying, this is where all the $ is, always...a shitco that printed x margin 20 years ago, can print that same margin today, and its never in ests despite that its the exact same business.
its all factories, boxes, stores, a pile of heavy assets...a dollar of revenue is gonna be damn near a dollar of net profit, in both directions, because the costs dont move
every co has new fancy multiple-accretive recurring revenue stability streams to reduce the lumpiness of earnings
and then it doesn't snow in Colorado, Vail's revenue goes down 3% and their EBITDA goes down 40%
and u realize that u overpaid for a levered shitco multiple arbitrage roll-up, and that ski resorts have always been shitty low-multiple businesses
this is what buffett talks about with "when good mgmt meets shitty economics, the economics always win"
"our revenue is high-quality, because of our new loyalty program which grew 30% y/y"
like...u sell furniture over the internet
or the economy rolls over, the loyalty program isnt so loyal, Vegas traffic and casino revenues get cut in half, and EPS goes negative
the operating leverage inherent in a business model is not something that changes, thats why this has to be mastered and is worth the time
6.
go stare at HTZ financials. play around with tiny changes in capacity utilization or pricing, and u will see why it chapters out every 5 years
or AMC, see what a dollar of revenue lollapalooza's itself into. u can prob trace 1 movie ticket --> $10m of market cap
thats what happens when 1 rev dollar = 1 net profit dollar, and when current net profit = 1
1 + 1 = 2
aka, your earnings doubled
if it weren't for that torque, where the equity is effectively just a call option, the mkt cap of this should be about $2B lower (current: $2.3B)
"wait, how can an enterprise have market cap and be worthless at the same time?"
u will learn, my friend
its called
"schrodinger's shitco"
END
if I find other reading on this I'll post it but I don't think u can read ur way thru this, this is 100% modeling intensity
just staring at cogs/opex items trying to figure out wtf all this shit is and how it moves around
labor, R&D, are these fixed, are these variable, what about stock based comp, what about depreciation, how are each of these connected to revenue dollars, assuming they are at all, and why do people care about shit that isnt on the income statement like "inventories?"
after 10 or so years, u will arrive at the truth
"wow, 99% of GAAP accounting is complete fucking fiction."
and thats when u say, u know what, I'm just gonna find stocks that are already going up and buy the ones with sweet sounding names
50% long "SharkNinja" and 50% long SpaceX into the lock-up expiry
buffett spoke of this
good luck modeling
https://t.co/M1kbbBqXHd
"NO BULLSHIT" RESEARCH CHECKLIST
I really think these 7 bullets, while they might seem overly blunt, are going to carry more weight than the 300 pages of dogshit people toss around.
"is the company's Depreciation Schedule 7 years instead of 6?"
Dude that shit doesnt matter. Read this fucking list. This is what matters.
FOR STOCK ABC
1. bullish tape? (y/n) (ideally printing new ATHs or within 5% of ATHs)
2.
a. is ABC printing new ATHs or within 5% of new ATHs?
b. are ABC's fundamentals accelerating, is it in a positive earnings revisions cycle? (bonus: industry tailwinds?)
3. If 1 and 2 are yes, and ABC stock pulls back, LOCATE YOUR FUCKING BALLS AND BUY THE DIP.
4. Is fed dovish or hawkish? If easing cycle is underway, locate your balls and size up. If hiking cycle is underway, ignore your balls and cut size.
5. Stay on top of fundamentals, but PRIORITIZE TECHNICAL MOMENTUM. If the stock is printing new ATHs do not fucking sell it, its prob telling u that fundamentals have another leg higher.
6. VERY IMPORTANT: If there is an earnings inflection quarter, a 20-25% gap higher, where ROIC inflects and the narrative changes, you may have to take the position from 15% to 30%. This is what winners do. Locate your balls and buy the fuck out of those record highs.
7. STOPS: honestly no idea, your guess is as good as mine. if the mkt trades like shit, consider trimming.
--
8. if deferred tax expense goes from 0.4% of sales to 0.5% of sales, the company may be engaging in accounting shenigans!
HAHAHAHAHAHAH
just kidding. none of that shit matters
if u cannot grab your fucking stones and increase a 20% position to a 30%, on a 20% earnings gap to new ATHs, u are not built for this shit - period.
good luck trading
PYTHON is difficult to learn, but not anymore!
Introducing "The Ultimate Python ebook "PDF.
You will get:
• 74+ pages cheatsheet
• Save 100+ hours on research
And for 24 hrs, it's 100% FREE!
To get it, just:
1. Like & RT
2. Reply "Py"
3. Follow @Alokkumarzz [MUST]
Nobody knows beyond a Point.
Most Bull Markets start from pessimism, and when you least expect.
A Bear Market needs a preceding bull Market.
https://t.co/Ad3vWUpeYl
Be disciplined and Open Minded
The market hasn't made money for 18 months!
Since I am hearing this quite a bit, a perspective on what historically followed the "dead 18 month period".
Source: @EdelweissMF
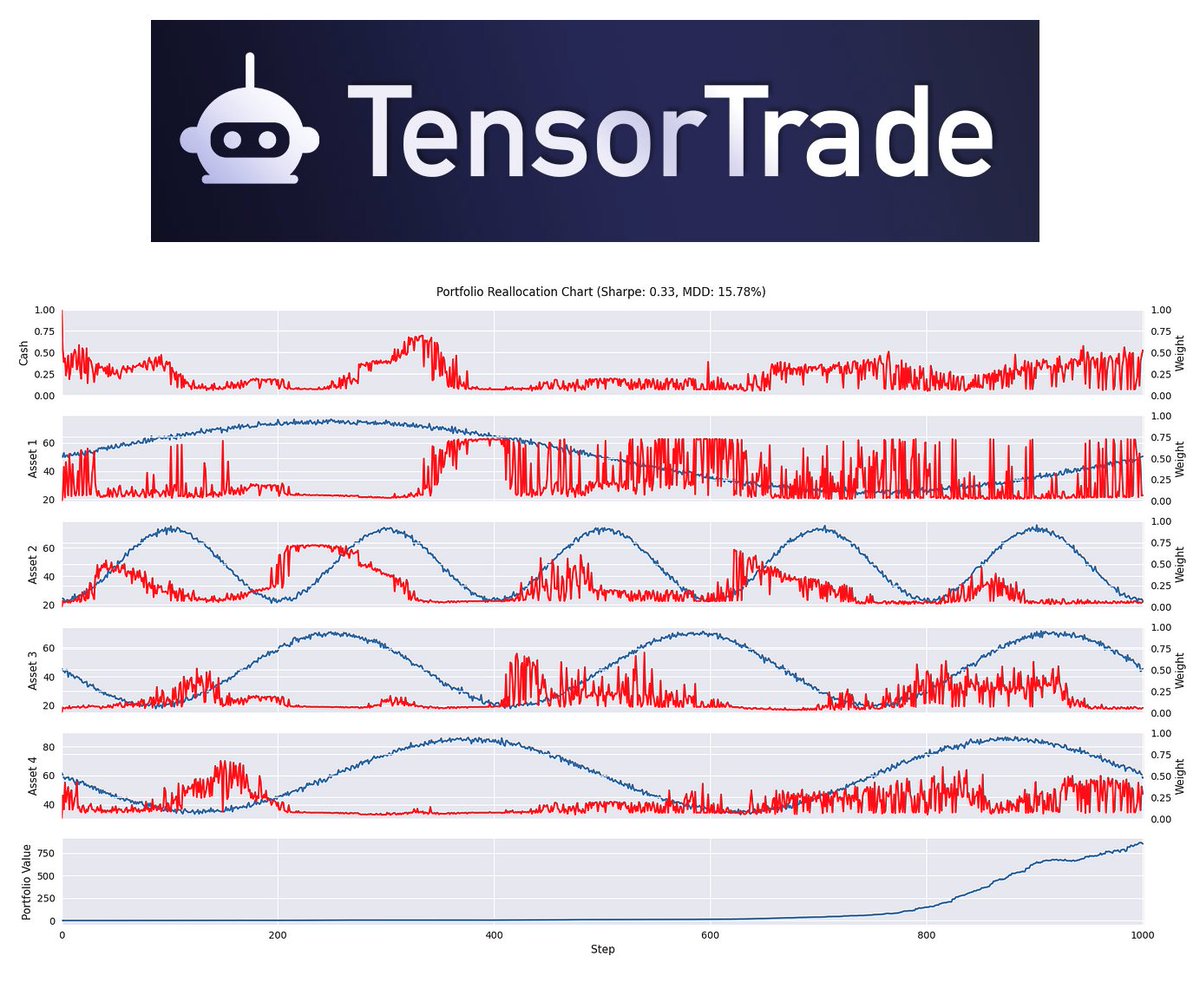
🚨BREAKING: A new Python library for algorithmic trading.
Introducing TensorTrade: An open-source Python framework for trading using Reinforcement Learning (AI)
🔴 "GIVEAWAY OF All SCANNERS + MARKET BREADTH SHEET"
🟧 Giveaway of complete Scanners that I use every day to make my watchlist.
✅Comment " Scanners"
✅Like + Retweet
✅DM me for Complete Scanners
(Need to follow @pheonix_trader for DM)
Investors are piling into emerging markets at a record pace:
Emerging Markets ETFs attracted +$20.6 billion in inflows last month, the biggest monthly intake on record.
This marks the 12th consecutive monthly inflow.
This also nearly TRIPLES the prior two months and DOUBLES the previous peak set in 2018.
The MSCI Emerging Markets ETF, $IEMG, covering 24 emerging market countries, attracted $8.9 billion in inflows, or 43% of the total, its largest monthly intake since its inception in 2012.
As a result, the MSCI Emerging Market Index rallied +8.8% in January, its best start to a year since 2012.
Bullish momentum in emerging markets is accelerating.