

Top Tweets for #QIResearch

The Weekly Quill — Insuring the Life Insurers
#Quill
#DiMartinoBooth
#QIResearch
https://t.co/CzupY508dS

The Weekly Quill — Insuring the Life Insurers
#Quill
#DiMartinoBooth
#QIResearch
https://t.co/exD2JJxJcD

Thanks in no small part to real estate, June has been hopping in bankruptcy courts. We regularly track the PPI for bankruptcy courts at #QIResearch.

🚨 Wholesale property depot files for chapter 11 in Florida
WHOLESALE PROPERTY DEPOT, LLC
📊 Assets: $1M-$10M | Liabilities: $1M-$10M | Creditors: 50-99 | Industry: Real Estate Investment and Wholesaling | District: Middle District of Florida
Chapter 11 – Filing Summary
_____________________________________________
Middle District of Florida • June 29, 2026
WHOLESALE PROPERTY DEPOT, LLC, a Jacksonville, FL-based real estate investment and wholesaling firm, filed for chapter 11 protection on June 29, 2026 in the Middle District of Florida.
The company currently operates as a real estate acquisition entity managed by Clayborn Jones. Recent operations have been impacted by legal challenges, including a non-homestead residential foreclosure action involving US Bank National Association as of May 2026.
Key Details
_____________________________________________
– Named as defendant in non-homestead residential foreclosure action in 2026 [Source: Jacksonville Daily Record (2026)]
– Principal place of business maintained in Jacksonville as of 2025 [Source: Florida Department of State (2025)]
– Median time on market for local Jacksonville real estate reached 57 days in 2026 [Source: Realtor (2026)]
Real Estate Investment and Wholesaling: NAICS 531390 – Other Activities Related to Real Estate. The company specializes in the acquisition and wholesaling of residential properties.
⚖️ Professionals
_____________________________________________
Debtor's Counsel: Law Offices of Mickler & Mickler, LLP
#Bankruptcy #Chapter11 #RealEstate
*Data from court filings & verified sources. All sources should require independent verification. Not financial advice.
https://t.co/Ge89TQucDz
The Weekly Quill — The Princely Scientists — The Power of Selectively Deceptive Data
Sign in now to read the latest from @dimartinobooth and Jonathan Basile of #QIResearch
https://t.co/HNkzbnNxL1
#federalreserve #powell #economy #dimartinobooth

The Weekly Quill — The Princely Scientists — The Power of Selectively Deceptive Data
Sign in now to read the latest from @dimartinobooth and Jonathan Basile of #QIResearch
https://t.co/r8mkpVrloi
#federalreserve #powell #economy #dimartinobooth

The Weekly Quill — Res Ipsa Loquitur
Private Credit Speaks for Itself
From Danielle DiMartino Booth and #QIResearch
https://t.co/puLw4aiRoS
#federalreserve #powell #economy #dimartinobooth #privatecredit. #credit

Years ago, #QIResearch ran the correlation between @truflation and official inflation statistics. The result: 97%. Now that it’s on the @business terminal, mainstream adoption has risen & our analysis revisited.
Consider yourselves warned @federalreserve
Big HT @TheBondFreak
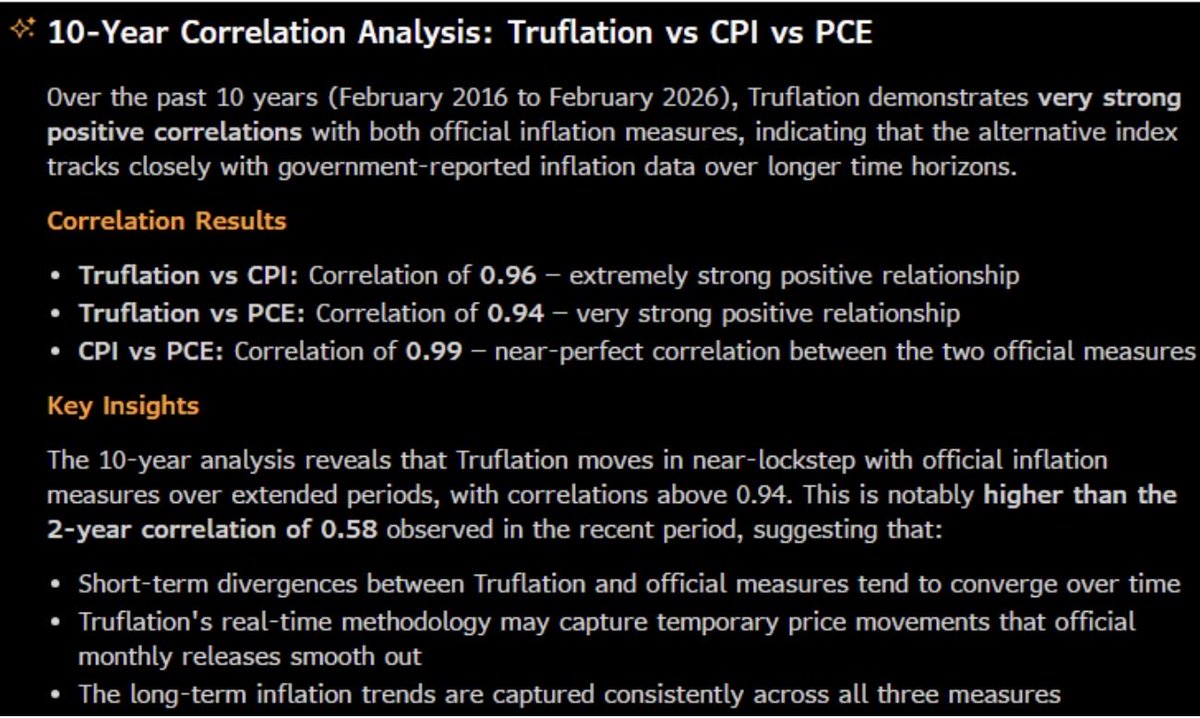
What he said. We do crank out some great charts at #QIResearch

🇺🇸 Op de Amerikaanse huizenmarkt zien we stijgend aanbod en een prijsstijging die een stuk lager is dan de huidige 2,4% inflatie.
Via @DiMartinoBooth

Caveat:
@ism warned about the regularity of seasonal restocking
#QIResearch predicted the VERY REAL demand surge given stockpiles had been depleted to such a degree, the only option was to restock or cease production, aka go out of business
Question: Restocking or Renaissance?

The financial media immediately added an asterisk to this number suggesting it was a one off by incorporating random qoutes. Their biases have hurt investors throughout this entire rally.
Back to the alternative dataset drawing board. Oh, wait. We’ve always tapped alternatives at #QIResearch
Trust but Verify is in our DNA.
https://t.co/0M6VDf2BYJ

Congrats on the correct market consensus!
Today's US CPI inflation is 0.98% based on real-time actual price data collected by Truflation.
@Polymarket @Kalshi @coinbase, how about a prediction market settled with our data that doesn't shut down when the government does?

Long post via #QIResearch daily takeaway:
If Powell has tired of being the public whipping boy, the most elegant solution on January 28th would be for the 19 members of the Federal Open Market Committee (FOMC) to elect Governor Christopher Waller to the position of Chair of the FOMC for calendar year 2026. Meanwhile, Powell would step back three months early from his capacity as FOMC Chair and complete his four-year term, as planned, by May, and then stays on to exhaust his term as Board governor through January 2028. The president could theoretically be compelled, encouraged by Bessent and leaders of banking system, to choose Waller to also be Fed Chair. It follows that Waller’s Federal Open Market Committee and its membership could thereby exit the political arena and ease policy (cut rates) into the labor market recession, allowing its members to stop lying to the public solely to protect and indemnify Fed Independence from political encroachment.
cc @AnnaEconomist @pdacosta @SenThomTillis @bondstrategist @biancoresearch
Of the 654,000 private sector jobs created in 2025 (before benchmark revisions take a machete to that figure) any guesses on how many were created outside private education & healthcare, ie, workers training the nurses to care for aging Boomers?
We delve into this at #QIResearch

BLS Employment Situation In December 2025 And Reading Past the Noise
The unemployment rate is just unemployed divided by the labor force. In December, the number of unemployed fell by 278k, while employment rose 232k and the labor force slipped 46k. That combination mechanically pushes the rate down (from 4.5% to 4.4%). The “improvement” is mostly a numerator story (fewer counted as unemployed) with a small assist from the denominator (a slightly smaller labor force).
Then read the footnotes (where the real story lives)
Two things matter here if you’re being skeptical…
• Seasonal adjustment got revised. BLS updated seasonal factors and revised household survey history. Notably, November’s unemployment rate was revised down (4.6 to 4.5). So part of the drop people see is revision plus seasonality, not some dramatic new shift in December.
• This is household survey territory, it’s noisy. BLS basically tells you this in the technical note: the monthly change in the unemployment rate has a confidence interval on the order of ±0.2 percentage point. A 0.1 move is not a clean signal. It’s a watch it, not a declare it.
If You’re Hunting Recession Fingerprints, Don’t Stare At U-3
The recessionary tells in this report aren’t the headline rate, they’re the quality and persistence underneath it…
• Underemployment is elevated. People working part time for economic reasons are 5.3M, and that’s up 980k over the year. That’s employers and workers meeting each other at the margin, not in confident full time hiring.
• Hidden slack is growing. People not in the labor force who currently want a job are 6.2M, up 684k over the year. That’s the quiet way labor markets weaken: more people want work, but they’re not counted in U-3 because they aren’t “actively”searching in the last 4 weeks.
• Long term unemployment is creeping. Long term unemployed are 1.9M, up 397k over the year, and they’re 26% of all unemployed. That’s a classic late cycle deterioration: hiring slows, and unemployment becomes stickier.
• Broader measures still look worse than a year ago. Even though they improved a bit in December, U-6 is 8.4% (vs 7.6% a year ago), and U-4/U-5 follow the same better this month, worse over the year pattern.
The Payroll Survey Is Waving A Bigger Red Flag Than The Unemployment Rate
Payrolls were +50k and BLS basically says you can’t hang your hat on that month to month: the confidence band for monthly payroll change is large enough that +50k can still be no change statistically.
The more important tells…
• The 3 month average payroll change is negative (about ‑22k). That’s stall speed.
• Revisions went the wrong way. October and November were revised down (combined ‑76k). In turning points, revisions often betray the initial optimism.
• Sector mix looks defensive. Gains are concentrated in food services, health care, social assistance while retail trade lost 25k and areas like transport and warehousing and temp help are weak. That’s households still spending, but the goods and credit cycle is tightening.
•Hours are slipping. The workweek edged down, and the aggregate hours index fell. In real downturns, employers usually cut hours first, then heads. This is the early part of that movie.
The Outlier I’d Circle In Red Ink
Federal government employment down 277k since January (‑9.2%) is a huge swing and the report explicitly notes that people on paid leave or ongoing severance can still be counted as employed in the establishment survey. Essentially some labor market pain can get time shifted in how it shows up.
My View
The unemployment rate didn’t really improve it slipped inside a noisy, revision heavy month and doesn’t change the macro picture.
The signal is underneath where job growth is stalling, hours are rolling over, and underemployment and long term unemployment are rising. That’s usually what shows up before the headline rate breaks.

Correct as #QIResearch clients read today.
The Fed is mandated with making monetary policy for the “public good.”

Sunday is the day of rest, but not for battered women, more than half of whom rely on food assistance to feed their children after fleeing.
Please join my family, #QIResearch & my clients in donating to https://t.co/2sRZa07UbM
$298 ($10/day) gives moms a month of food security.
#QIResearch in the news
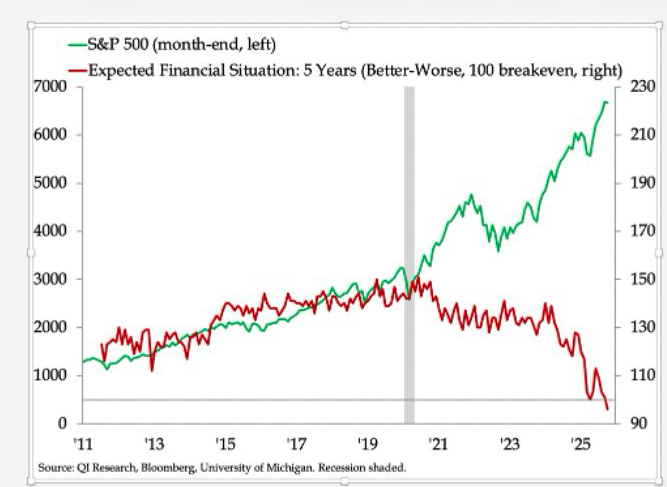
"Historic breakdown in US households’ expectations for their financial security pitted against the stock market that’s driven spending of the top 10% depicts the inequality divide that defines the United States as a nation today."
https://t.co/ZOjhOmz2wY
The Weekly Quill — Artificial Theatre
Sign in now to read this week's deep dive —
i
#QIResearch
#dimartinobooth
#federalreserve
#artificialintelligence
https://t.co/Gprq1nehee

The Weekly Quill — Artificial Theatre
Sign in now to read this week's deep dive —
i
#QIResearch
#dimartinobooth
#federalreserve
#artificialintelligence
https://t.co/uTJ5pzVbra

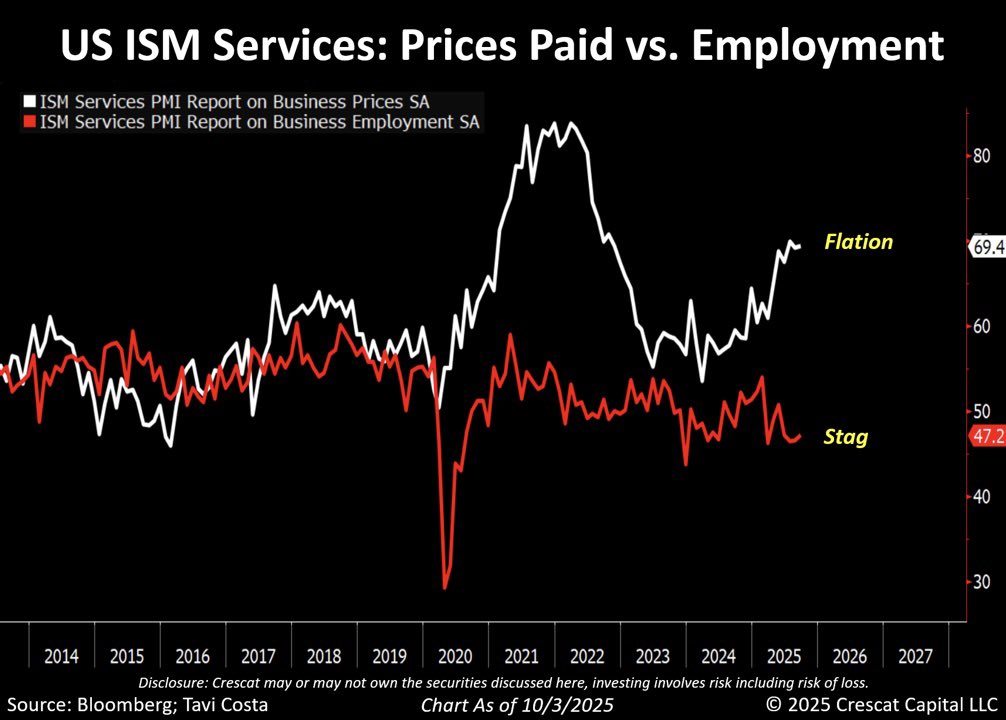
The critical distinction as pointed out by #QIResearch Director of Research @HolyGrailEcon is LABELING.
“Prices Paid” are COSTS over which buying firms have ZERO control as they’ve no way to negotiate down input costs.
“Employment” is the sole COST said firms control.
ERGO…?

Deeply stagflationary.
The latest ISM Services report was a clear display of the Fed’s predicament.
The prices paid component is now pushing toward the 70 handle, while employment has dropped well below 50.
And remember, this reflects services, not goods.
On the goods side — which commodity prices help illustrate — inflationary pressures continue to build and accelerate.
You got that right @DonMiami3!!
At #QIResearch we rank Gross State Product by reliance on sectors (eg mfg, travel)
After UT, at 8.5%, NV ranks 2nd, at 7.8%, in terms of the intensity exerted economically by Construction sector
National average is 4.5% of GDP
TY @HolyGrailEcon

This is a huge warning sign to the Nevada economy

It’s been bugging me too @Econ_Parker because it’s a red herring.
What better time to introduce @HolyGrailEcon to @X I say!
Please join me in following #QIResearch Director of Research Jonathan Basile who created this chart showing spike tied to TX summer rise in WARN notices.


After catching up with @EconBerger, something is bugging me about the flood deadline triggering a wave of unemployment insurance applications...
Typically, there is an immediate spike in claims in the weeks following a disaster like hurricanes / floods.
Thus, I find it odd that in the immediate aftermath of the floods and the weeks that followed, there was only a modest increase in claims.
See prior recent examples with the severe storms and flooding in June '23 and Hurricane Beryl in July '24.
Some more thoughts and case studies in the🧵

Last Seen Hashtags on Sotwe
animation #fart
Seen from Spain
ديااثة
Seen from Saudi Arabia
momsonn()*****
cuckoldindo
Seen from Indonesia
Omegle
Seen from Pakistan
NoLimits video
Seen from Brazil
Thundr
Seen from United States
omegle(*)*****************************************
bursatravesti
Seen from Turkey
festival piss
Seen from United Kingdom
Most Popular Users

Elon Musk 
@elonmusk
241.5M followers

Barack Obama
@barackobama
119M followers

Cristiano Ronaldo
@cristiano
114M followers

Donald J. Trump
@realdonaldtrump
111.8M followers

Narendra Modi
@narendramodi
107.2M followers

Rihanna
@rihanna
98.6M followers

NASA
@nasa
92.4M followers

Justin Bieber
@justinbieber
91.8M followers

KATY PERRY
@katyperry
89.8M followers

Taylor Swift
@taylorswift13
83.7M followers

Lady Gaga
@ladygaga
75.2M followers

Virat Kohli
@imvkohli
73M followers

Kim Kardashian
@kimkardashian
70.8M followers

YouTube
@youtube
68.8M followers

Neymar Jr
@neymarjr
66M followers

Bill Gates
@billgates
65M followers

Selena Gomez
@selenagomez
62.8M followers

The Ellen Show
@theellenshow
62.3M followers

CNN
@cnn
61.8M followers

X
@x
60.7M followers