Top Tweets for #Waterfallchart

Master data visualization with our tutorial on creating a Stacked Waterfall Chart in Excel! 📊
✨ Watch now: https://t.co/ladpkXWBli
#Excel #WaterfallChart #DataViz

🚀 Waterfall Charts in JS 💻
Learn to build interactive waterfall charts for your web page or app with our new tutorial, easily visualizing a running total as values are added or subtracted:
👉 https://t.co/Ote3CVdjWm
📊🔍📝
#waterfallchart #dataviz #webdev #frontend #javascript


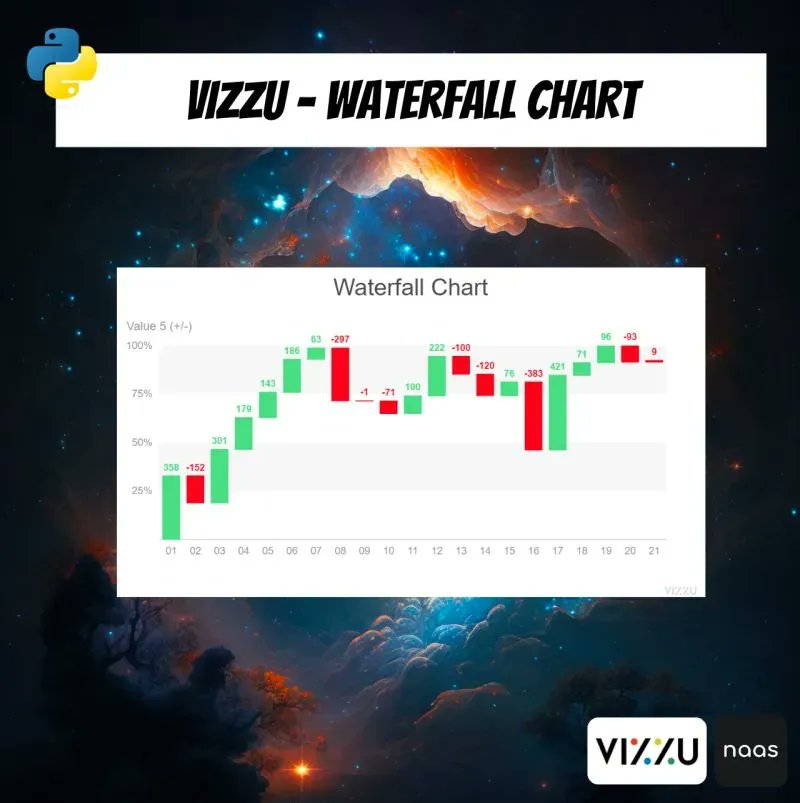
Another beautiful chart from @VizzuHQ: the waterfall! 🌊
This notebook helps you in creating an interactive waterfall chart to display your data, which may be valuable in financial and sales analysis.
Check it out: https://t.co/3wLiZRyRvI
#waterfallchart #vizzu #analytics

📈📊 Want to create stunning Waterfall Charts in #Matplotlib? Check out this informative blog post by #Oraask! 👨💻💻
🔗 Read the full post from the link in the first comment 👇👇
#DataVisualization #WaterfallChart #Finance #Python #Programming #TechTips

New release: Waterfall charts! Perfect for your profitability analysis 💯
#waterfallchart

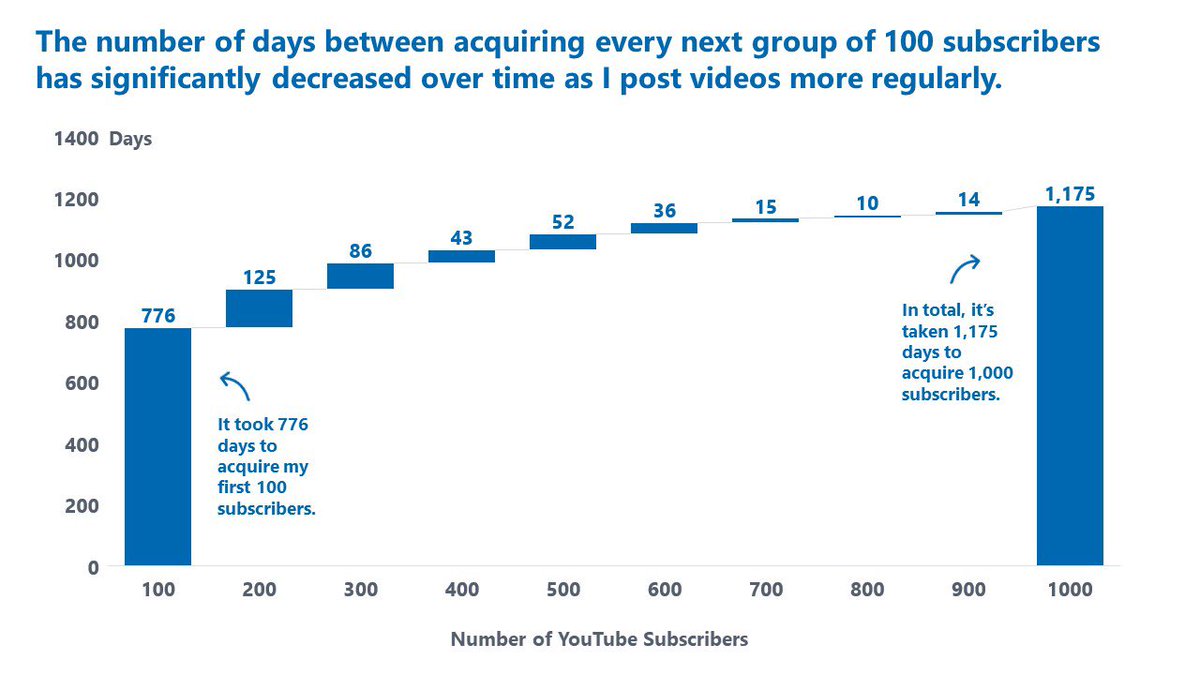
The day has come! 1K subscribers achieved. It took 1,175 days to do it. Many lessons learned, many still to come! So many thanks to everyone who’s watched, subscribed, and supported 🙏🏻 https://t.co/06LXXEpjk7
#waterfallchart

My first-ever #WaterfallChart, and I did NOT look up a tutorial 🤓 OK, I've done Likert charts in the past and thought: "This has to be similar" - and it is! #TableCalculations #WOW2022 #WorkoutWednesday
https://t.co/QwxN6P2SaF @LukeStanke @HipsterVizNinja @_hughej @YetterDataViz

✨#ShowMeMore2.7 is out now!✨
This new release brings valuable enhancements to the #NetworkDiagram, the #WaterfallChart and the most popular visualization type – the #SankeyDiagram.
Watch the video to see some of these updates in action: https://t.co/pYhkIQxMmY
#Tableau


How to Create a Waterfall Chart in React With visx: https://t.co/PGx0m4Pbvt #React #DataVisualization #Visx #WaterfallChart #JavaScript
How to Create a Waterfall Chart in React With visx: https://t.co/PGx0m4Pbvt #React #DataVisualization #Visx #WaterfallChart #JavaScript

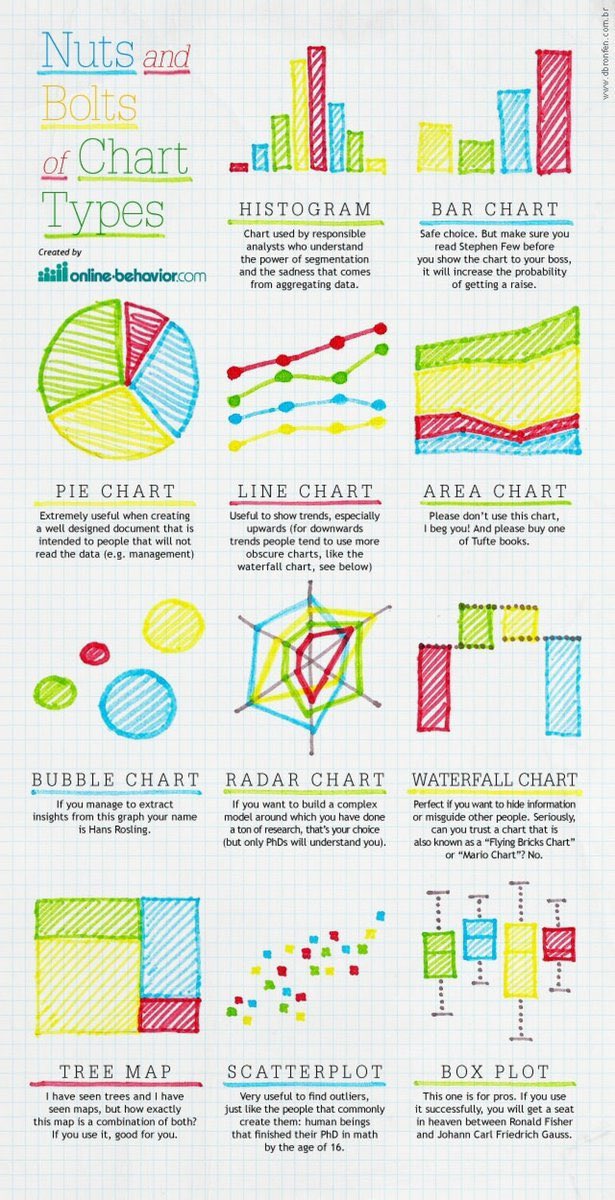
Nuts and bolts of Chart Types. #histogram #Barchart #Piechart #Linechart #Areachart #Bubblechart #Radarchart #Waterfallchart #Treemap #Scatterplot #Boxplot
Do you want to quickly and easily create a Waterfall Chart in Tableau? It’s possible with the ShowMeMore extension!
Watch the tutorial here: https://t.co/TY41BW6Vsh
#tableau #tableauextensions #showmemore #waterfallchart


If you want to try creating financial waterfall charts yourself, check out this pipeline at https://t.co/hN2jcX6QYo!
https://t.co/lKm9c2FOZ1
#finance #income #tothemoon #ai #datavisualization #data #dataprediction #waterfallchart

3/3) How to Analyze a Waterfall Chart
https://t.co/WWpzsu9CTy
#webperformance #gtmetrix #lighthouse #waterfallchart
2/3) How to Read a Waterfall Chart for Beginners
https://t.co/r05VQpihRD
#webperformance #gtmetrix #lighthouse #waterfallchart
The Waterfall Chart is hugely helpful with investigating web performance issues!
Get a crash course on how to make the best use of it with these articles:
1/3) How to Use the GTmetrix Waterfall Chart
https://t.co/f8RmV1JV3j
#webperformance #gtmetrix #lighthouse #waterfallchart

In this video👉 https://t.co/AceVodcfNT, you will learn the meaning of EBITDA and how it’s calculated and how to create an EBITDA bridge with a waterfall chart. Share, like and subscribe! #Excel #youexceltutorials #msexcel #ebitda #financialanalysis #profitability #waterfallchart
Another quick release! Waterfall Charts are now visible on smaller resolutions.
More changelog items here:
https://t.co/ClleU0hWSN
#webperformance #gtmetrix #lighthouse #waterfallchart
The Waterfall Chart can help you understand how your page behaves during loading for further insights.
Check out our basic guide on how to read them:
https://t.co/kcqmikh39d
#webperformance #gtmetrix #lighthouse #waterfallchart
🌊 Want to know how to create a #WaterfallChart for a web page or app? A new tutorial on our blog will get you fully prepared for that sort of #DataVisualization development with #JavaScript 💪
🔥 Just posted! 🆕
https://t.co/JyHGTeno8k
(Showing Alphabet's 2020 income statement.)

Trends for you
Most Popular Users

Elon Musk 
@elonmusk
240.2M followers

Barack Obama
@barackobama
119.3M followers

Donald J. Trump
@realdonaldtrump
111.6M followers

Cristiano Ronaldo
@cristiano
109.4M followers

Narendra Modi
@narendramodi
106.9M followers

Rihanna
@rihanna
97.4M followers

NASA
@nasa
92.1M followers

Justin Bieber
@justinbieber
90.7M followers

KATY PERRY
@katyperry
87.1M followers

Taylor Swift
@taylorswift13
80.9M followers

Lady Gaga
@ladygaga
72.4M followers

Kim Kardashian
@kimkardashian
69.5M followers

Virat Kohli
@imvkohli
68.9M followers

YouTube
@youtube
68.6M followers

Bill Gates
@billgates
63.5M followers

The Ellen Show
@theellenshow
62.5M followers

CNN
@cnn
61.9M followers

Neymar Jr
@neymarjr
61.5M followers

X
@x
60.9M followers

Selena Gomez
@selenagomez
60.2M followers