$AUDUSD
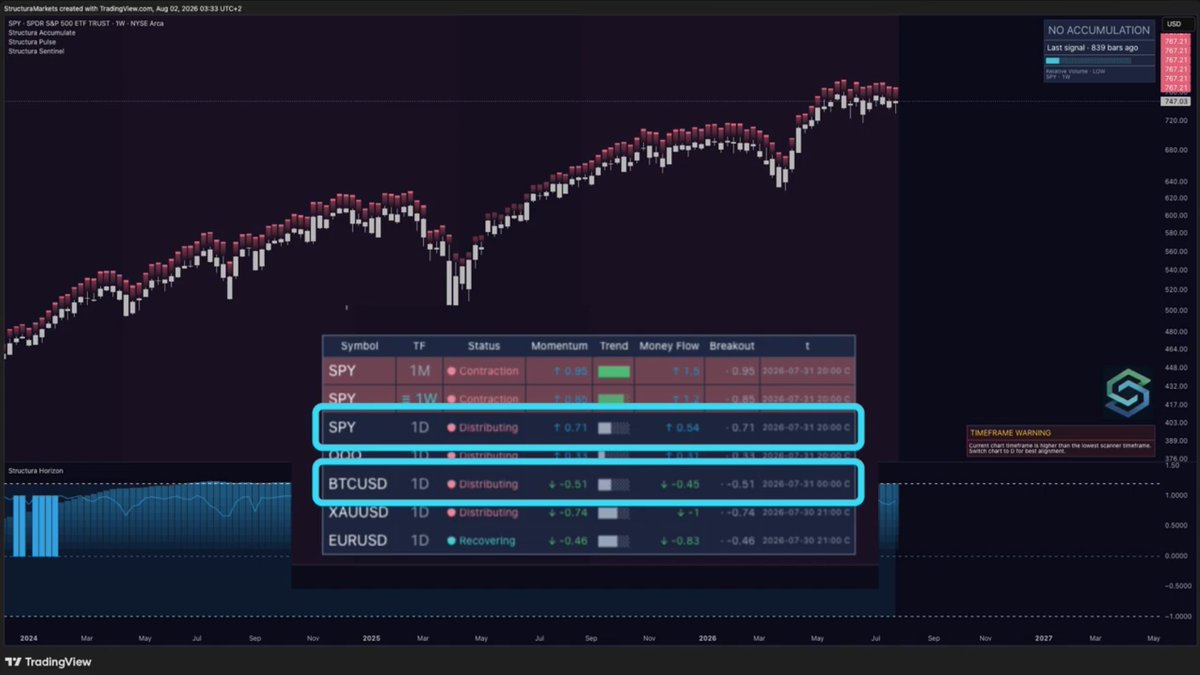
The Australian dollar has climbed back into the band where the trend layer spent all spring drawing its structure overhead. Weekly still reads Recovering; daily and four-hour already read Distributing - the two faster clocks flipped, the slow one hasn't.
The part to track is the gap: momentum runs hot on every clock while money flow is barely positive. Price has moved a long way ahead of the flow behind it, on low relative volume.
The structural layer hasn't stamped this chart in over two hundred bars. The only reference it left sits far below - a wide stretch of price with nothing built under it.
Members read the full version earlier.
That was fun - reading structure live while the market was still arguing with itself. Thanks @MikeMKTs and @TrendSpider for having us at the table. If you caught the stream: the structure layer we were reading from is free - link in bio.
China 50 is testing the upper edge of its 12h accumulation zone - the third zone printed since July.
The stack, in order:
4H Recovering with momentum back above zero (+0.34).
12H Recovering, momentum still negative.
Daily hasn't confirmed - still Distributing.
Lower timeframes lead, higher timeframes confirm. That's the sequence, not a contradiction.
Caveat: relative volume is LOW. Thin-participation breakouts resolve both ways — acceptance above the zone is information, rejection back inside is too.
#CN50 #China50 #HSI #MarketStructure #TechnicalAnalysis
Hang Seng has bounced cleanly off the July low, and our scanner still has the weekly labeled Distributing.
That is not a contradiction. It is a hierarchy.
The daily flipped to Recovering. The weekly has not. Sticky labels describe the phase, not the last candle - a phase changes when the opposite zone is triggered, not when price starts feeling better.
The line worth watching is inside the daily itself: momentum reads 0.57 and rising, money flow reads -0.44. On the weekly and the 4H both point the same way. Only the daily has them pulling apart, and the gap is the information, not the level of either.
Two ways it closes. Flow catches up and the higher timeframe label follows the daily. Or momentum drifts back toward flow and the bounce stays a bounce inside a distributing phase.
Both are answers. We are watching which one prints.
#HSI #HangSeng #MarketStructure #TechnicalAnalysis #TradingView
Gold has not merely kept pace with global money creation.
From January 2000 to March 2025:
Global M2 compounded at roughly 7.1% annually.
Silver compounded at roughly 7.7% annually.
Gold compounded at roughly 9.8% annually.
Over the full period:
Global money supply expanded about 5.6x.
Silver rose about 6.5x.
Gold rose about 10.5x.
That difference becomes enormous when compounded over 25 years.
The implication is clear:
Gold has not simply protected investors from monetary dilution. It has gained purchasing power relative to the global pool of money itself.
This outperformance is also evidence that precious metals front-run monetary dilution.
And despite gold’s spectacular rise, the Gold/US M2 ratio is still far below its 1980 extreme.
From current levels, gold would need to rise by roughly 150% relative to US money supply merely to revisit the 1980 monetary peak.
In nominal terms, gold looks expensive.
Relative to the quantity of money already created, and the dilution still ahead—it is not expensive at all.
Silver also outperformed money supply, but only modestly and with far greater volatility. It remains the higher-beta monetary asset: capable of explosive overshoots during liquidity and physical-scarcity phases, but also long periods of underperformance.
Gold is the structural monetary hedge.
Silver is the leveraged expression of the same thesis.
If fiscal dominance and sovereign debt stress continue forcing policymakers toward larger monetary interventions, metals do not need extraordinary assumptions to move significantly higher.
They only need to continue front-running the dilution that lies ahead.
Yesterday, three things happened at once.
The founders voted their first tool onto the roadmap - Divergence ships mid-August. Sentinel learned to read your chart's hierarchy by itself. And our Sunday read became something you can watch.
One detail from the vote worth sharing: every future release gets its own ballot. The people using the system decide what gets built next - a standing seat at the roadmap table, not a one-time survey.
The Sunday Read, episode 1 - on our YouTube. New one every Sunday.
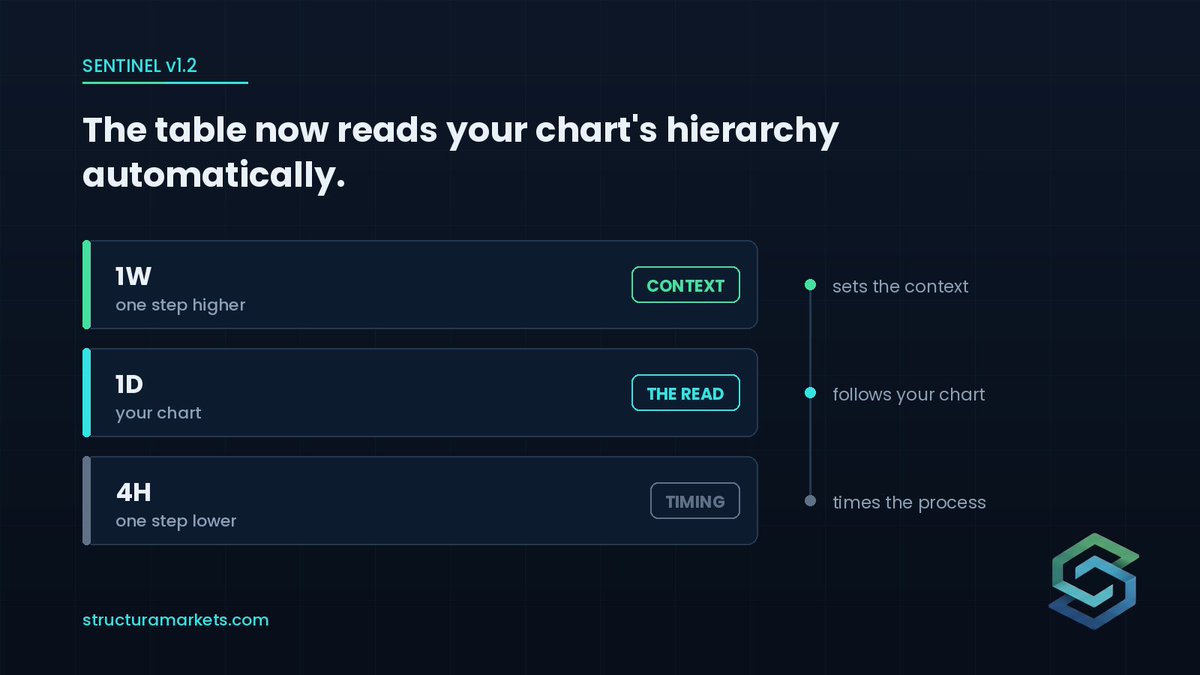
Your chart's timeframe never tells the whole story.
Sentinel now reads the hierarchy for you - one step higher for context, one lower for timing, automatically.
The higher timeframe sets the context; the lower one times the process.
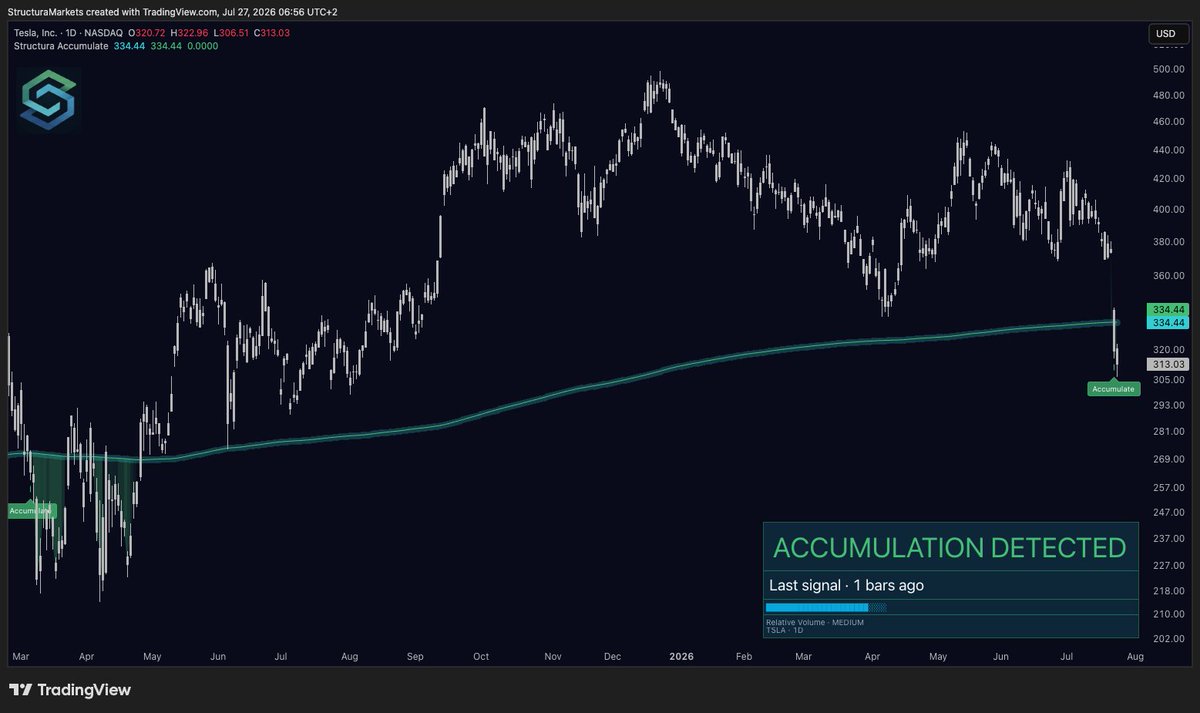
Two bars ago, price entered a fresh accumulation zone on $TSLA - and closed below the reference.
Two bars tells you three things: where the structural reference sits, that the decline reached base-building territory, and that entry volume was unremarkable.
It cannot tell you acceptance or rejection. That answer takes weeks, and no opinion shortens the clock.
First zone on this chart in fifteen months. The tool finally spoke. Now the market answers.
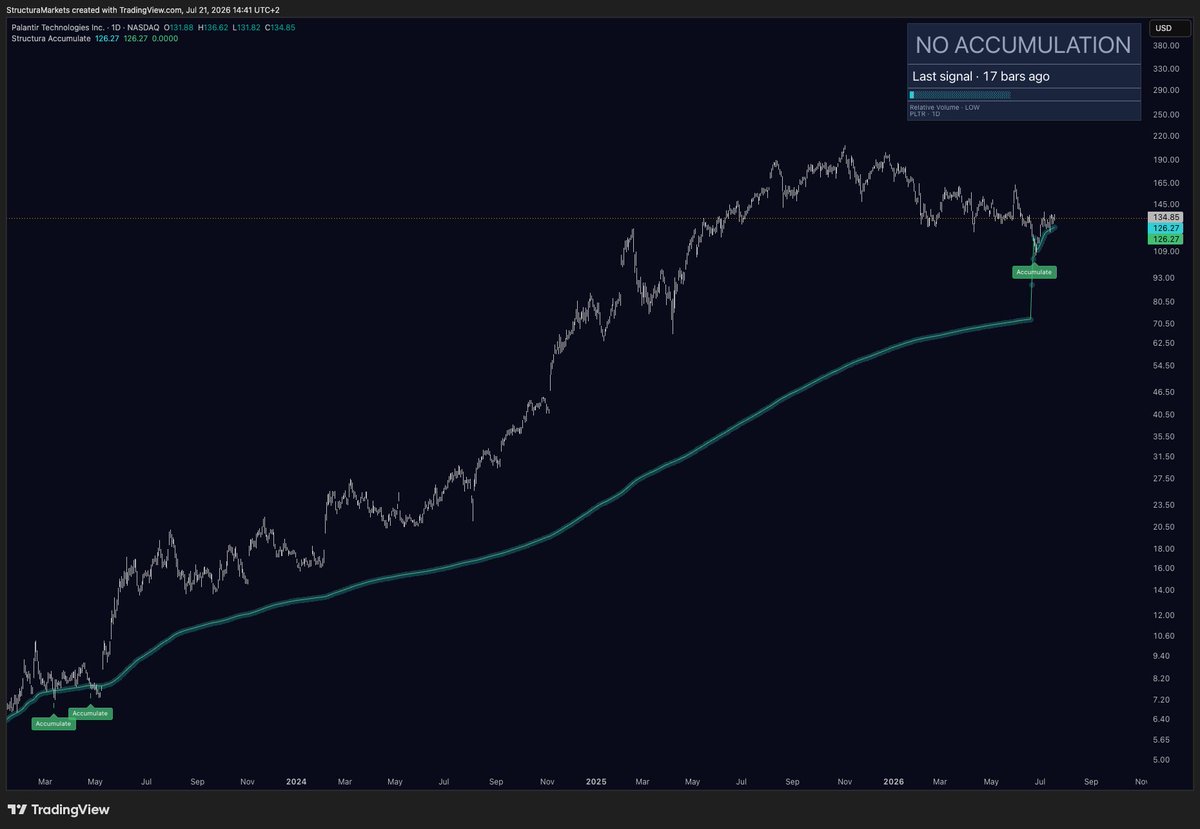
Two accumulation zones on $PLTR , three years apart.
May 2023: a zone near $8, marked while nobody was watching. Then silence - through the entire advance, not one signal.
17 bars ago: the first fresh zone since.
The honest read: the old zone didn't predict the move - it identified structure being rebuilt. Zones can fail. The new one is a question, not an answer: acceptance or rejection, the market decides.
Full breakdown on our TradingView - link in bio.
Momentum has three states: washed out, recovering, overheated.
QQQ through the Horizon lens - three full cycles in 18 months. Blue = overheated, green = washed out. The color intensity is the conviction.
We publish a structure read like this every Sunday - market by market, layer by layer. Free, link in bio.
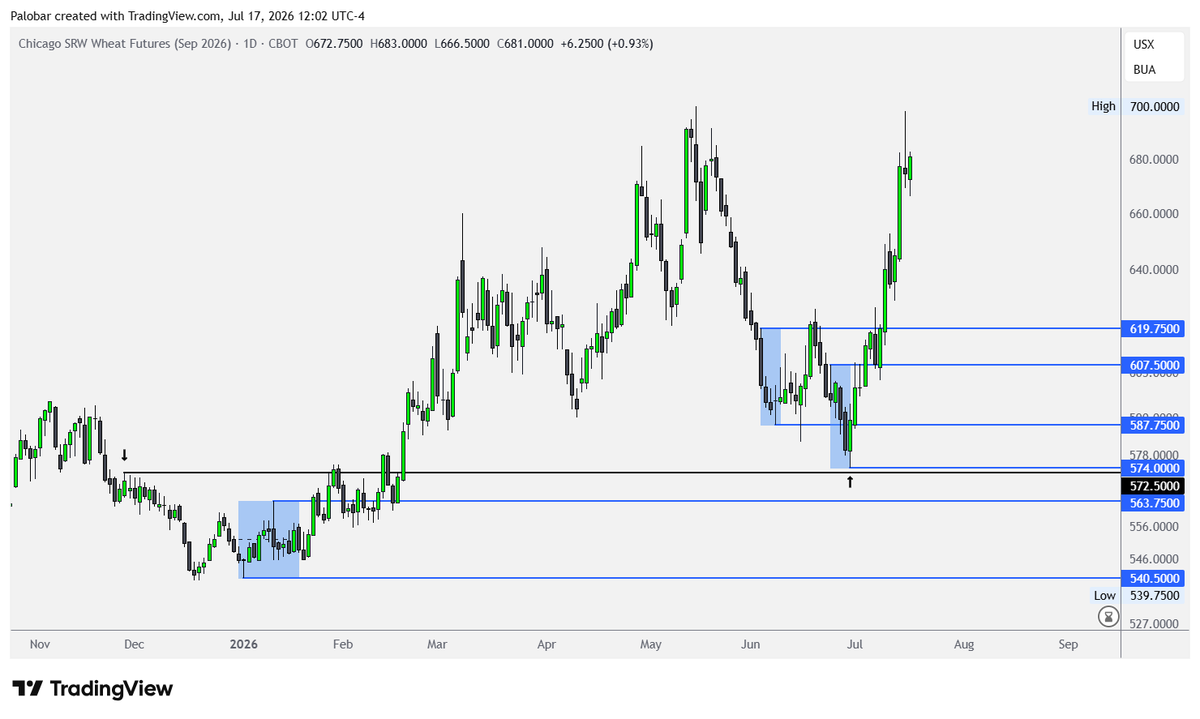
#Wheat $ZW_F #ags#grains#commodities
NEW ALL-TIME HIGHS coming in the following months.
The FINAL LOW is in.
The SECONDARY LOW is in (most likely). Our target was $572.5 (actual low $574).
If we get a pullback in the ~$620 area, it will be a gift. Every major move begins from a professional A/D (see my article on this concept).
We were never building another signal generator. Arrows telling you what to do aren't what the market's missing. We built a way to read structure - where a market is positioning, where momentum turns, where trend confirms or breaks.
Signals tell you what happened. Structure tells you where you are. Markets move through the same cycle over and over - accumulation → compression → expansion → exhaustion → reset. We map the phase you're in, so decisions carry context, not emotion.
When we started TrendGo, the goal was to cut through market noise. Along the way we realised the name described what we did - not what we'd built. So today, TrendGo became Structura. Here's why 🧵
Same system. Same team. Clearer name. TrendGo is now Structura - because we never built a signal generator. We built a way to read market structure. Full story in the pinned thread 🧵
Dollar made a fresh high, but Oil failed to confirm.
This is an important divergence.
The recent dollar strength was initially fueled by the Oil supply shock:
Oil higher → importers need more dollars → FX stress → DXY higher.
But now the picture is changing.
If DXY keeps pushing higher while Oil refuses to follow, it means the market is no longer pricing only supply shock inflation.
It is starting to price marginal demand destruction + liquidity stress in importing countries.
In simple terms:
Oil created the dollar stress first.
Now the strong dollar plus higher prices driven by supply shock is starting to suppress Oil.
For non-US buyers, a stronger dollar makes Oil more expensive in local currency terms. So even if supply risk remains, marginal demand starts getting hit.
Either Oil catches up and confirms another supply-shock leg, or Oil breaks down and confirms that demand reduction has started.
This does not mean Oil prices must fall from here. A fresh escalation or further supply shock can still push Oil above $120, because the inelastic part of Oil demand cannot be destroyed easily.
This post is only highlighting the change in behaviour.
Now one of them has to be proven wrong.
Either Oil catches up and confirms another supply-shock leg, or dollar catches down.
The next few sessions will be very important.