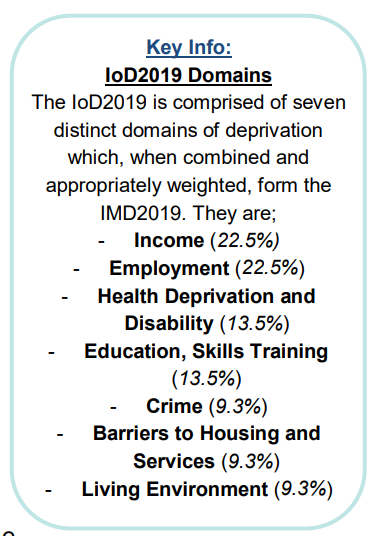
This account is not affiliated with MHCLG, please contact them directly for official response on English Indices of Deprivation 2019: https://t.co/xp4J9D0DxW
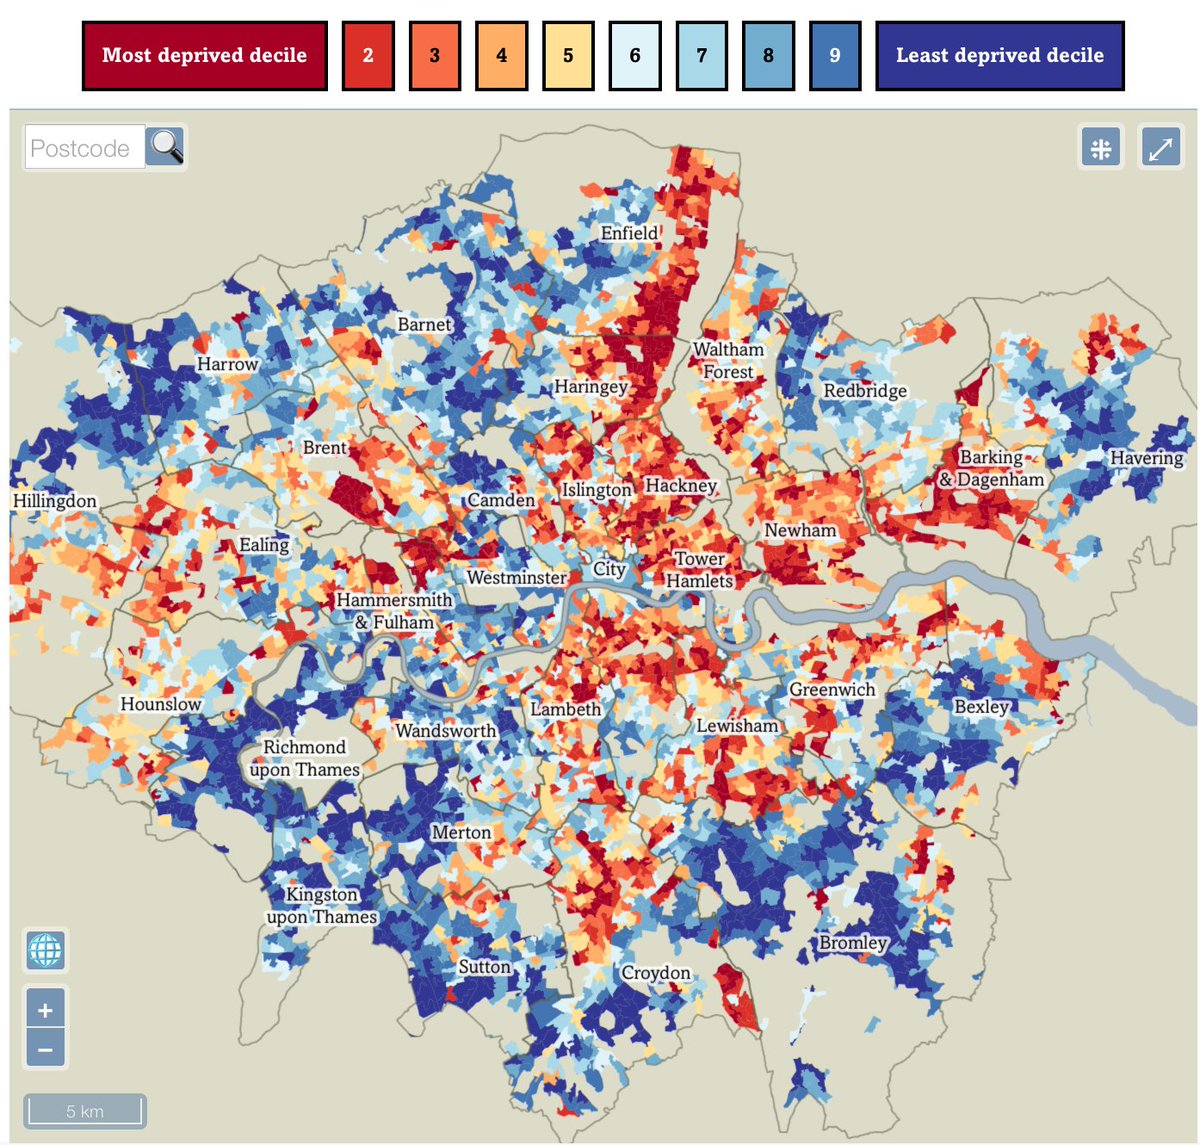
🗺️This year’s #LondonsPovertyProfile includes new interactive maps built by @oobr of @CDRC_UK, making #poverty & deprivation indicators easier to view & interpret
For example, check out the below Index of Multiple Deprivation map, rebased for #London: https://t.co/2ilWtIHjoH
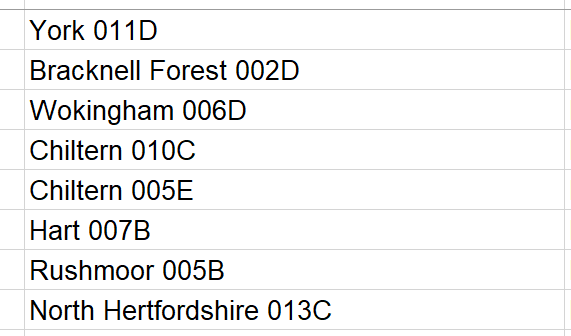
A few more observations about the Indices of Deprivation 2019 now I've had time to digest things. Here are the 8 LSOAs that feature in the least deprived decile on all seven domains:
@mapsnstats Hi Adrian, we are retweeting the analysis we are coming across and will be steadily adding it all to our resource site: https://t.co/eBwUe3LZ36
Huge thanks to @Tableau, @ConcentraUK and everyone who took the time out to come together in Birmingham on Tuesday to feed into the development of this tool. I hope people find it useful 😀 @mhclg@ocsi_uk#IoD2019#localgov#publicsector#collaboration https://t.co/Ql8VzhwZFS
Today @MHCLG@ocsi_uk released the English 2019 Index of Multiple Deprivation figures – the first release in 4 years. The maps compare the deprivation in 2015 to 2019. Main takeaway: no dramatic change.
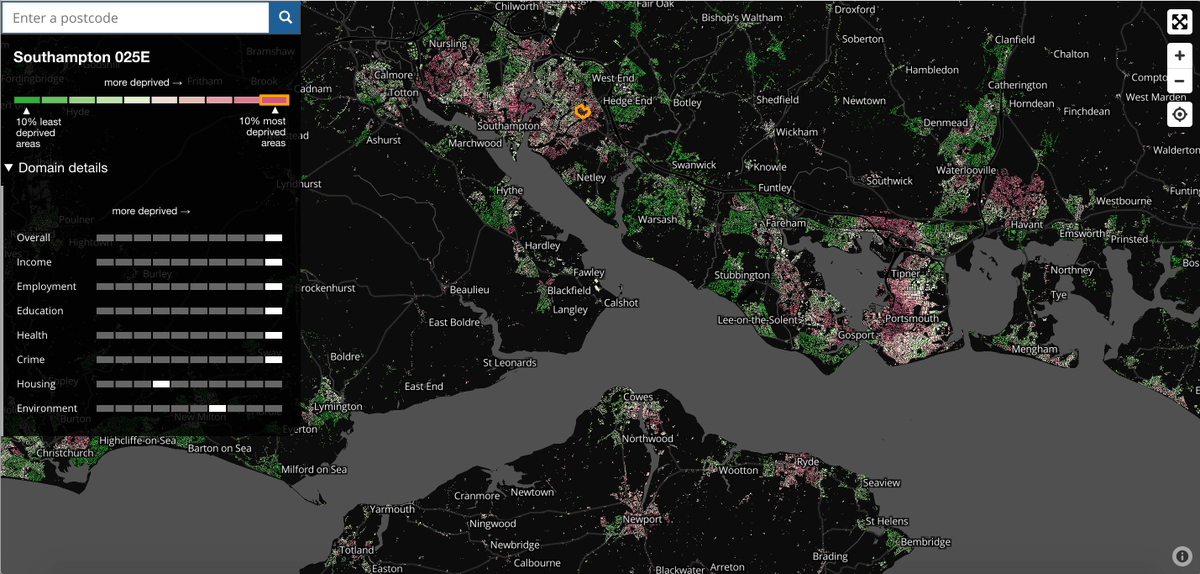
@undertheraedar@mhclg Here's my updated #IoD2019 mapper too - https://t.co/AjgCmtM7CK, which supplements the main stats release and is one of various new mapping resources, including @undertheraedar's excellent maps.
All accessible here - https://t.co/DcZZ9aqXAq
My maps and stats for the English Indices of Deprivation 2019 are now online – all 317 local authorities here: https://t.co/0zhrwpD8MN (with links to @mhclg data and docs) – short thread with some highlights to follow