The one option flow I would actually pay attention to
@3peakstrading spent five years reading institutional option flow professionally, so I asked him what he actually looks for in it. His answer was narrower than I expected and better for it.
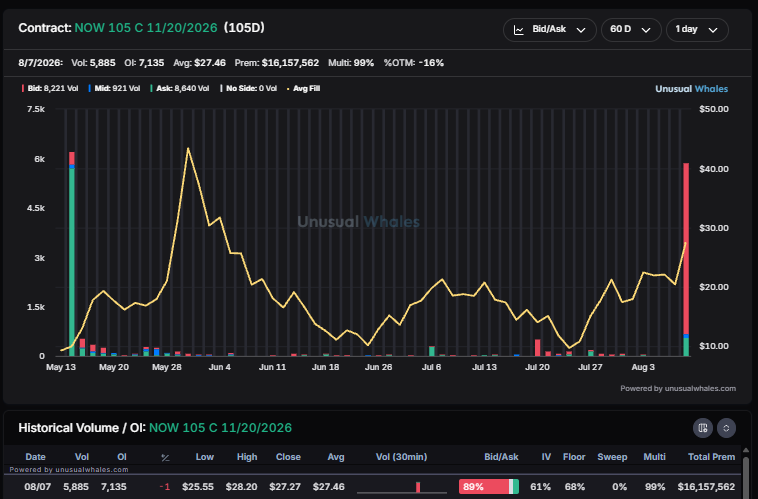
Large opening put sales.
The logic is about what the trade obligates you to do. When somebody sells a put in size, they are accepting an obligation to buy that stock at that strike. That is not a speculative position you can walk away from. It is a commitment, at a price, from somebody with the balance sheet to honour it. Very few flows carry that weight.
The word opening is doing real work there. You can tell a position is new rather than a roll or an unwind because there is little or no open interest at that strike. Volume higher than open interest is the check.
Then he scales it against the name. A million dollar trade in a mega cap is noise, it happens all day. The same premium in a biotech or a smaller commodity name is a different signal entirely. Twenty times the usual option volume in a quiet name is worth stopping for.
And the useful part afterwards is the level. Somebody with size has told you where they are willing to own it, which often behaves like support if the stock gets there.
Most flow data is people expressing a hope. This is somebody accepting a liability.
🚨 BREAKING: TradingView just made its biggest move in years.
AI is now built into the charts you already use every day. Most swing traders have no idea it's there.
Here are 8 features that change how you find and manage trades 👇
My 0DTE selling bot is now running every trading day.
So far, measured live slippage has been very close to my original assumptions.
My current workflow:
• Download historical option data from Databento
• Backtest actual option contracts with Python
• Run the same logic live through IBKR
• Match live trades against the backtest
• Measure the difference in fills and slippage
• Use an LLM to reconcile the logs and prepare a detailed daily report
The dark blue line is the lower risk, more active version I currently trade, recalibrated using the mean difference observed in my live fills:
• Sharpe: 1.43
• Profit factor: 1.26
• Win rate: 68.4%
• Fees and calibrated slippage included
• No compounding
I also plot a more pessimistic slippage assumption. Under that scenario, the Sharpe falls to 1.21.
The strategy itself is simple:
• Sell 0DTE verticals after the market moves lower, when option premiums are richer
• Let roughly 70% of positions expire
• Manage fast upside reversals, which are usually where this sleeve loses
That loss profile is useful at the portfolio level. A fast rebound can hurt this strategy while helping several of my other, mostly long, positions.
I am gaining confidence to increase the position size gradually, but the calibration is still ongoing. I need more live observations before treating any assumption as settled.
This chart is a calibrated backtest, not live P&L.
Everything 100% automated. All orders are limits.
The encouraging part is that another estimated input is being replaced by measured live evidence.
Crypto’s next institutional wave may be less about owning tokens and more about owning the regulated rails.
A thematic pick-and-shovel play on crypto commercialization:
Galaxy Digital ( $GLXY): institutional finance & infrastructure
Coinbase ( $COIN): trading, custody & market access
Circle ( $CRCL): USDC settlement & on-chain dollar payments
Read it free: https://t.co/Sah4RlEkph
Not financial advice.
Take my options strategies by the Greeks cheat sheet ... then:
Ask two questions:
1) What strategy for SPX best fits the current market?
2) In the VIX order book, are any desks putting on a big trade?
Answers:
1) SPX Sep 7800/8000 call backspread, 1×2, ~$38 credit.
2) VIX Nov 18/27 call spread, 2×1, ~1,100 on (8/17 flow, debit).
Why?
1) SPX Sep ATM ~12.3 (cheap vega to own), a nearly-flat call skew (sell 12.0, buy 11.4 — the credit). The trade is +vega/+vomma/+vanna/+gamma bullish, all convexity pointed up, done for a credit, pinned at 8000 expecting a slow grind; crash/chop/rip all keep the credit or better. The case is strengthened by Sep options chain data.
2) A desk that is betting on a contained vol regime shift, likely the Oct 27–28 / Dec 8–9 FOMC window, and financing it by writing the crash scenario.
The only time in history where the 30yr went from the 4%s to the 6%s within 6 months was June 1999.
73 trading days later, SPX was in a correction.
9 months later, SPX had its last ATH before falling into a years-long bear market.
To be clear, the 30yr is still under 6% now.
I get asked this a lot:
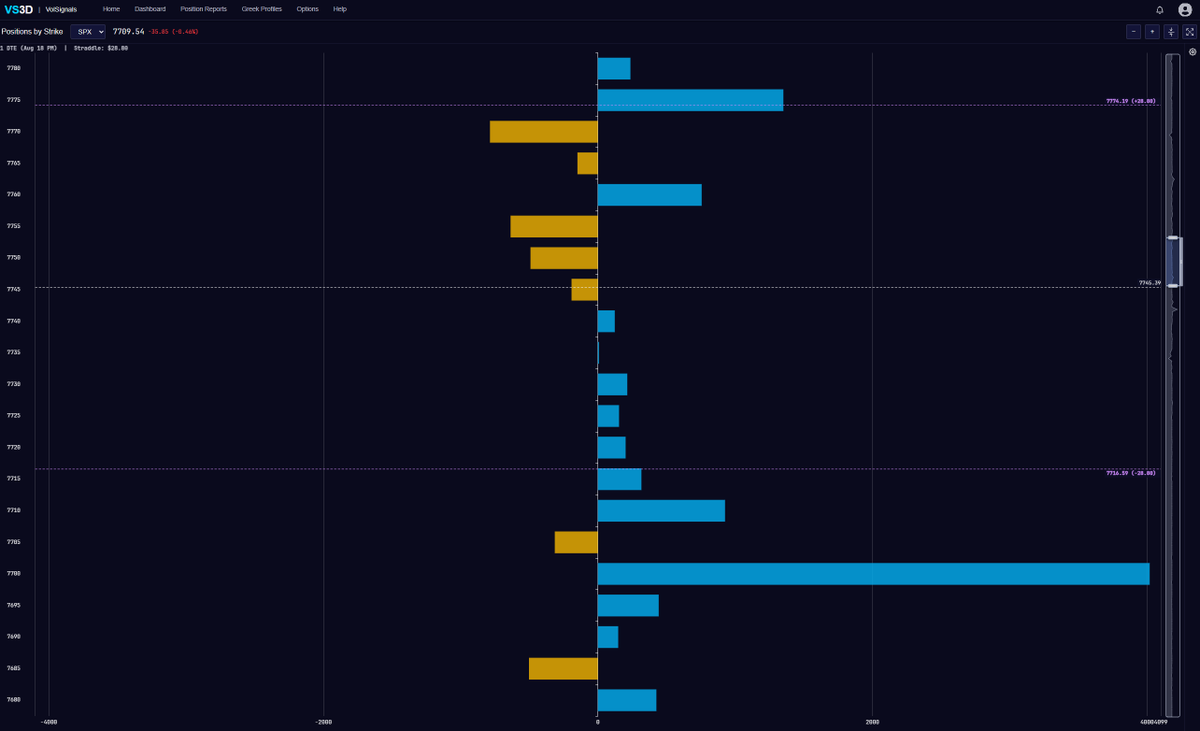
"Do positions / greeks have influence overnight?"
I'd naturally assume they do, since most firms are trading overnight- albeit sometimes more "loosely" and overseen by junior staff
Yesterday at the close I took a look at today's position
(attached)
TOP 10 MOST EFFICIENT AI NEOCLOUDS
This chart is a great way see which neoclouds are monetizing scarce AI power most efficiently and where the remaining upside still sits:
1. $IREN leads the group at ~$40M of contracted revenue per MW which shows how valuable its full-stack GPU cloud model can be once more of its secured power gets monetized.
2. $GLXY sits ~$29M per MW and still has meaningful approved capacity waiting on tenants which makes future contract conversion the main catalyst.
3. $CRWV generates ~$28M per MW and has already converted a large portion of its power footprint into contracted compute which shows how aggressively it has scaled demand.
4. $HUT also sits ~$28M per MW but has one of the largest remaining development pipelines which leaves substantial optionality if it can keep filling capacity.
5. $APLD monetizes ~$26M per MW with much of its remaining upside tied to capacity currently moving through construction and into contracted service.
6. $WULF sits ~$25M per MW which reflects a model that captures strong powered-shell economics but less value per watt than owning the compute layer.
7. $NBIS sits ~$23M per MW on long-term deals but is intentionally holding back capacity because short-term pricing has reached ~$50M per MW.
8. $CORZ generates ~$21M per MW largely driven by long-term infrastructure contracts rather than higher-value full-stack compute.
9. $CIFR sits ~$13M per MW which shows the tradeoff of powered-shell colocation where the customer owns the silicon and more of the margins sit upstream.
10. Crusoe doesn't disclose a clean revenue-per-MW figure but still has a large contracted footprint.
Bloomberg's US Financial Conditions index has loosened to its most accommodative since the 1990s. This measure accounts for money market, corporate and muni spreads, stock values and implied stock and bond volatility.
As long we 4491-93 holds the trade in Gold is short at 4490, take profit at 4447. Add under it to take proof at 4422 while maintaining the cote position from 4490 and 4447. Under 4422 look for the swing to complete at 4325. All the while your stops are at entry.
If we get abovr 4492 i will wait for confirmation above 4502(200 day sma). Gold always respects the 200 day. Use an active daily continuation chart if you use CQG.
Bullish Auction Market Profile patterns that lead to rallies.
What pattern did all of the paired market profile graphics shown below exhibit that set the stage for a subsequent rally. I'm applying Donald Jones' auction market value principles?
Simple Answer:
• the close travels from below value to above value across two sessions
• value (fairest price) migrates up
• session two concludes with unfinished business — a poor high to be revisited next session
Detailed Answer:
Day 1 — an incomplete auction
• Poor high made late. High printed in periods 7–8 on two or three TPOs. Poor high = an extreme with no singleton rejection tail, so the auction never advertised those prices as unacceptable. It stays available for retest.
• Failed late-session rally. Periods 7–8 carry price back up into the thin upper zone; period 9 collapses to the opposite extreme. Buyers were present and got run over into the bell.
• Close at or near the session low, below the TPOC. TPOC = price with maximum time diversity, i.e. where the auction agreed value was. Closing beneath it means the day ends with the market disagreeing with its own value.
• No excess at the low. Closing on the extreme means price was still probing at the bell — no punctuation mark. Incomplete auction: the next session is granted permission to probe lower until excess forms.
• b-shape or value in the lower half — heavy time at the bottom, thin above. Initiative selling.
Day 2 — permission for a retest of day 1's lows declined
• Opens above Day 1's close and the low holds there. The granted probe is refused outright. Refusal is stronger evidence than probe-and-reverse, because the market never even advertised those prices.
• Low holds at or above Day 1's TPOC in most cases — prior validated value becomes support on first contact.
• TPOC prints higher than Day 1's TPOC. Value migration up.
• VPOC and TPOC coincide at the new node. Volume and time agree at the same price: transaction with agreement, the inverse of the trapped-buyer divergence. Value is validated, not merely transacted.
• Buying tail from the open — periods 1–2 alone at the lows, never revisited. Responsive buying.
• Close above Day 2's own TPOC but below its high.
• Close above value confirms; close short of the extreme leaves the buying auction itself incomplete, with thin structure overhead that must be resolved.
Key reference prices
• Entry: Day 2's close.
• Anchor that must hold: Day 1's TPOC.
• First objective: Day 1's poor high — the one unresolved reference in the structure.
Invalidation of new long initiation
• Trade back below Day 1's close.
• Day 2's TPOC printing at or below Day 1's TPOC — value failed to migrate, and the whole premise is gone.
SHOCKING: Cancer is NOT the disease.
It’s the symptom of your immune system already collapsing.
Dr. Patrick Soon-Shiong just dropped a truth that rewrites everything we thought we knew about cancer and longevity: The real killer isn’t the tumor.
It’s when your Absolute Lymphocyte Count (ALC) — drops below 1,000 cells/μL. That’s lymphopenia.
We’ve spent 40+ years nuking the symptom with chemo and radiation… while those same treatments deliberately wipe out the exact cells that could have saved you. We treat the tumor and ignore the host. Your ALC is your immune army.
Low ALC = defenseless.
Now we can understand why there is an explosion in cancer since the Covid vaccine injection, because it lowers your immune system.
I've mapped the entire Wall Street bear playbook on AI names:
Have your favorite institution/media insert one of these name down below:
1. < ______ [GPUs, Transcivers, MLCC, Memory...] are a commodity set to crash>
2. < ______ [YMTC, CXMT, Dongshan...] from China will flood the market >
3. < ______ [Micron, Nvidia, ...] from unverifiable channel checks is facing issues >
4. < ______ [Kospi, Sivers, ...] is a bubble like the ____ [2007, 2021] crash>
5. <____ [1,2,3, ...] unexpected rate hikes this year>
6. < _____ [Google, Nvidia, Deepseek ...] optimization removes the need of this!>
in a new headline, and it's ready to go!
Market Wizard Linda Reschke's 12 Technical Trading Rules:
1. Buy the first pullback after a new high. Sell the first rally after a new low.
2. Afternoon strength or weakness should have follow through the next day.
3. The best trading reversals occur in the morning, not the afternoon.
4. The larger the market gaps, the greater the odds of continuation and a trend.
5. The way the market trades around the previous day’s high or low is a good indicator of the market’s technical strength or weakness.
6. The previous day’s high and low are two very important “pivot” points, for this was the definitive point where buyers or sellers came in the day before. Look for the market to either test and reverse off these points, or push through and show signs of continuation.
7. The last hour often tells the truth about how strong a trend truly is. “Smart” money shows their hand in the last hour, continuing to mark positions in their favor. As long as a market is having consecutive strong closes, look for up-trend to continue. The up trend is most likely to end when there is a morning rally first, followed by a weak close.
8. High volume on the close implies continuity the next morning in the direction of the last half-hour. In a strongly trending market, look for resumption of the trend in the last hour.
9. The first hour’s range establishes the framework for the rest of the trading day.
10. A greater percentage of the day’s range occurs in the first hour then was the case in the past, and thus it has become increasingly important to trade aggressively if there are early signs of a strong trend for the day.
11. There are four basic principles of price behavior which have held up over time. Confidence that a type of price action is a true principle is what allows a trader to develop a systematic approach.
The following four principles can be modeled and quantified and hold true for all time frames, all markets. The majority of patterns or systems that have a demonstrable edge are based on one of these four enduring principles of price behavior.
Charles Dow was one of the first to touch on them in his writings. Principle One:
A Trend Has a Higher Probability of Continuation than Reversal Principle Two:
Momentum Precedes Price Principle Three:
Trends End in a Climax Principle Four:
The Market Alternates between Range Expansion and Range Contraction!
12. In the world of money, which is a world shaped by human behavior, nobody has the foggiest notion of what will happen in the future. Mark that word –
Nobody! Thus the successful trader does not base moves on what supposedly will happen but reacts instead to what does happen.