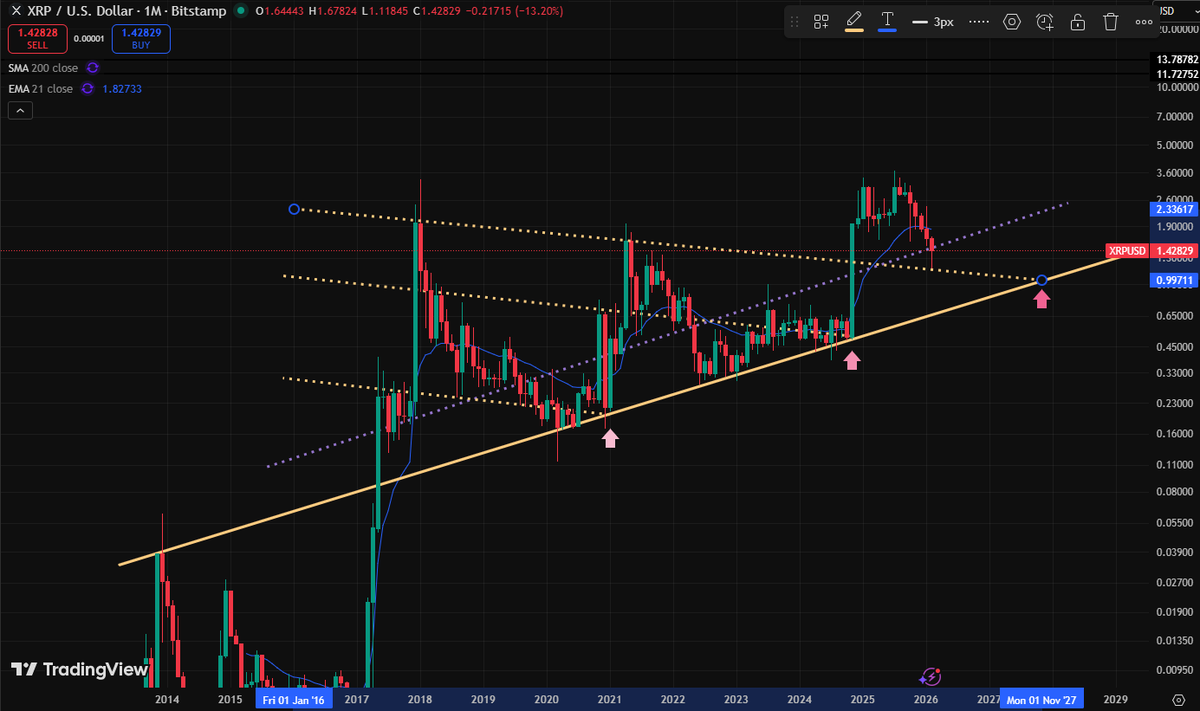
The most devastating scenario for $XRP - mirroring $BTC ’s price action from 2018 to today. The similarities so far are evident and concerning. In this case, we revisit sub-$1 in summer 2026, no new ATH until early 2028, and a peak around ~$6 in 2029.
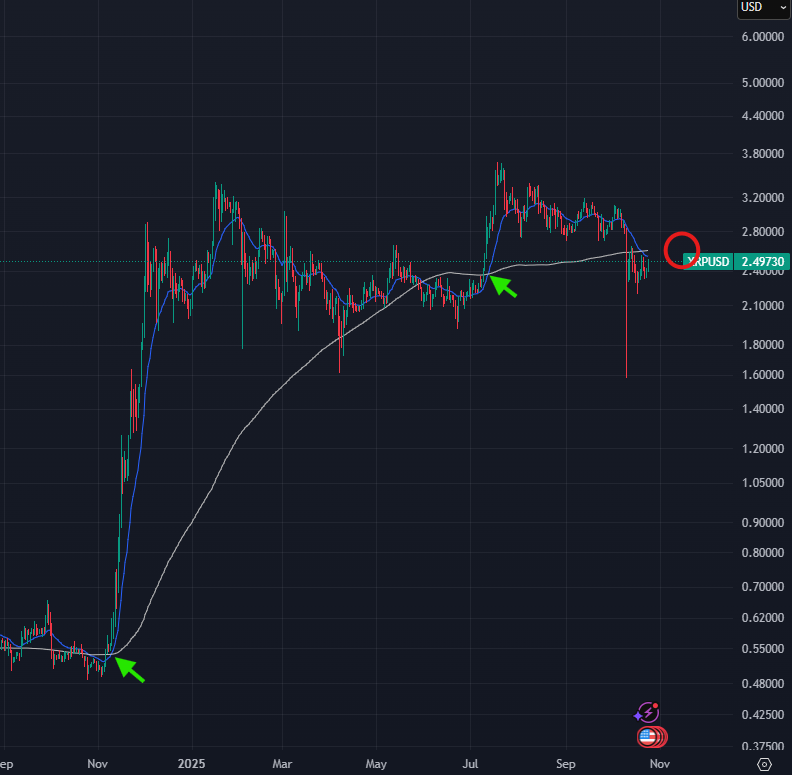
$XRP We’re at a critical moment - what’s next?
1️⃣ Yellow arrow (up): 🐃 price follows classic Wyckoff re-accumulation pattern
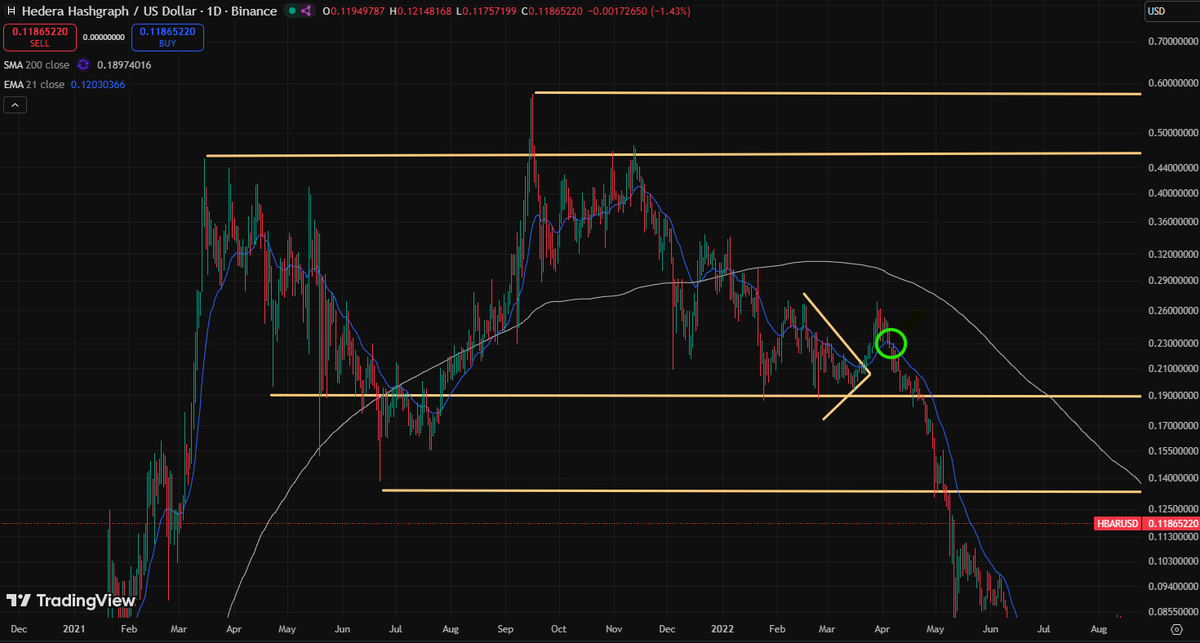
2️⃣ Red arrow (down): 🐻 loss of the 21-day EMA, continuing the fractal in play since early 2025 (see Hedera chart as an example)
This is what a confident breakout to ATHs looks like on $IWM.
Many people are wondering, why crypto is not following / catching up immediately?!
Historically, it takes ca. 100 days on average for $alts to catch up, which again brings us to Q1'26🔮
What you need now is patience.
Historical $BTC bull run patterns - they often peak after sentiment hits the high-80s or 90s. October 2025’s index of ~71 is notably lower than prior peaks:
$BTC usually hugs the 21EMA during bull runs. At the final phase, it detaches until the parabola’s peak.
Past cycle separations:
2014: 190%
2017: 225%
2021: 85%
If the top is in, this cycle’s 43% would be the weakest & most disappointing in $BTC ’s history