📝 Are you using multispecies occupancy models to investigate interactions in species occupancy (i.e. co-occurrence)? 🦁🦓
Check out our new paper for advice on the number of sites you need to reliably detect interactions under different scenarios https://t.co/tm8dzdq6cj
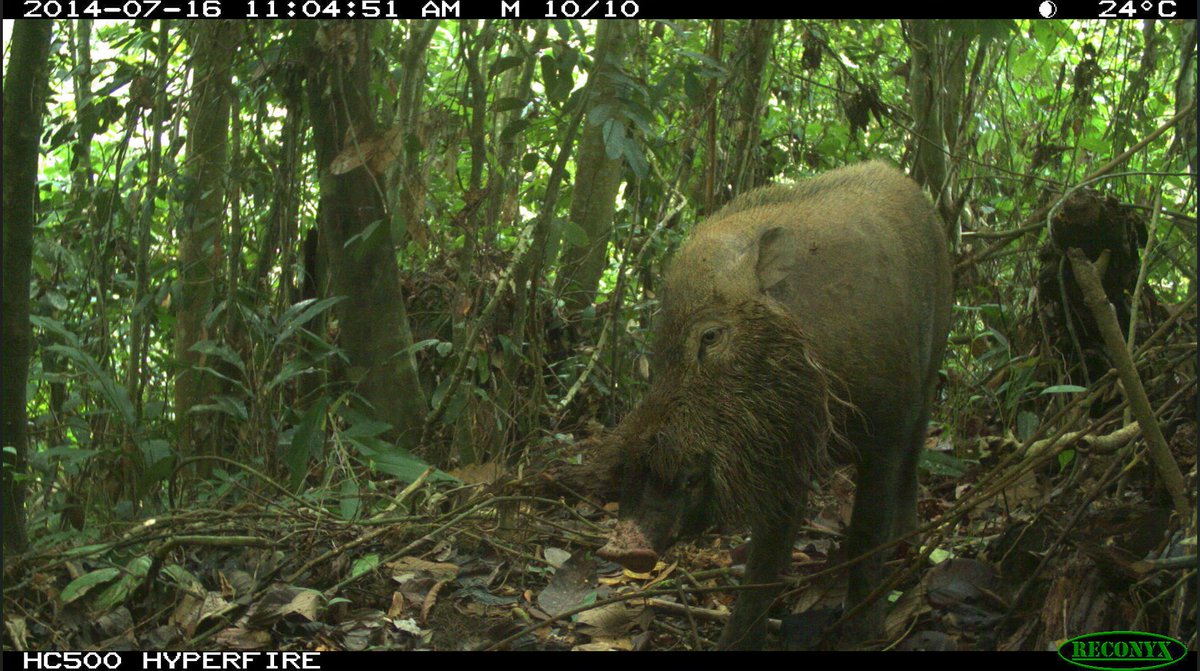
It's time to value tropical fieldworkers as equal partners.
With billions spent on watching forests from space, foresters and botanists have never been more vital. In our @Nature correspondence we show why, and what needs to change. https://t.co/IC7gdzkugv
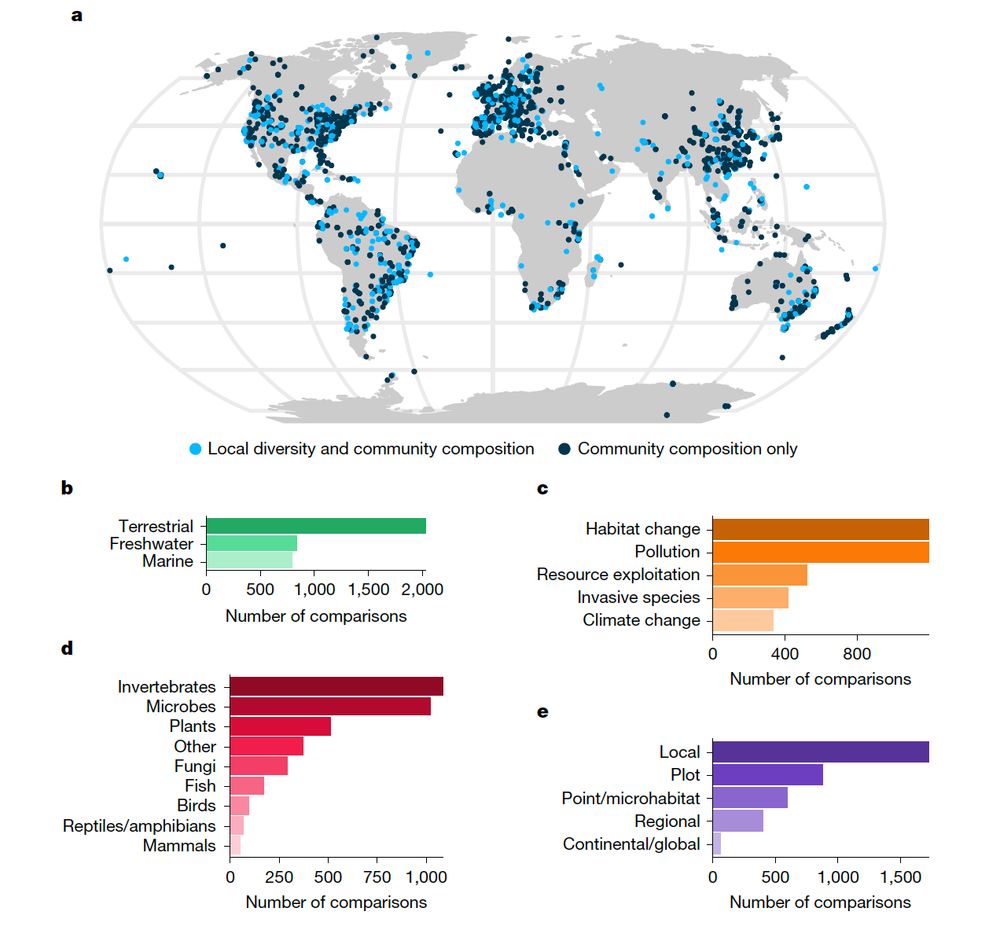
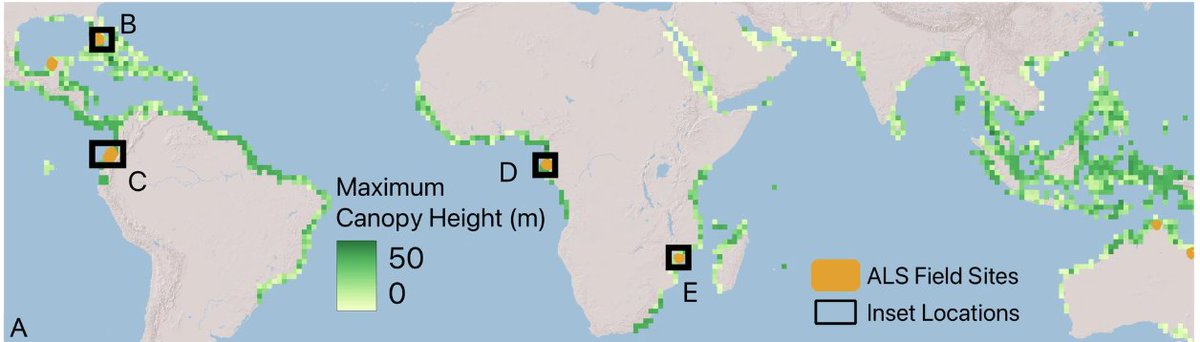
Our study ‘The #global#human impact on #biodiversity’ is out @Nature https://t.co/l43XvFrxWQ
🌍🌐🐟🌿🪲 🫎🦋🐝🪲
Unprecedented #synthesis of >2000 studies shows humans are not only shrinking species numbers—but reshaping entire communities across the planet.
🧵1/4
Excited to share our latest work in @JournalofRS! A novel algorithm to automatically map & monitor intertidal #seagrass meadows by integrating optical & SAR images. The algorithm was tested across 15 sites globally.
Read more: 🔗 https://t.co/L1DPOyzELp
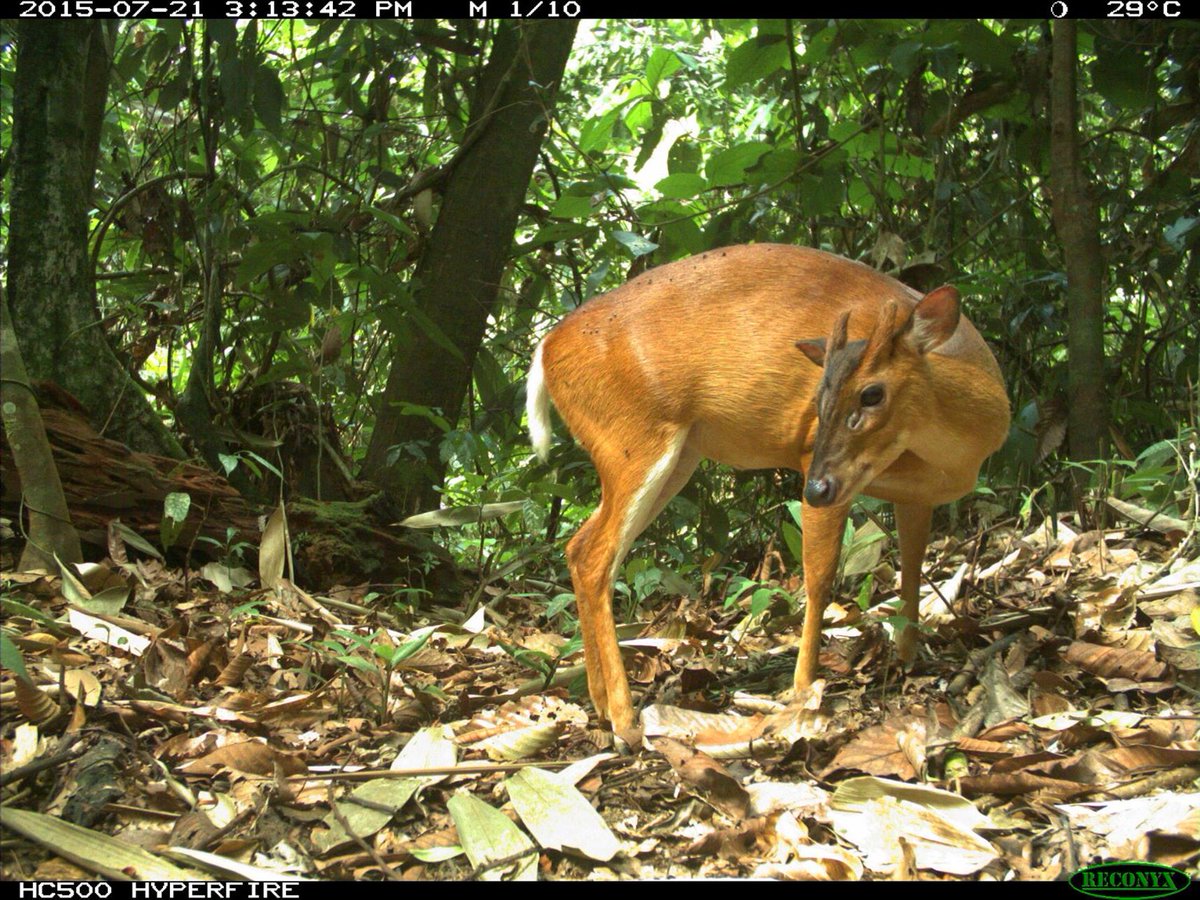
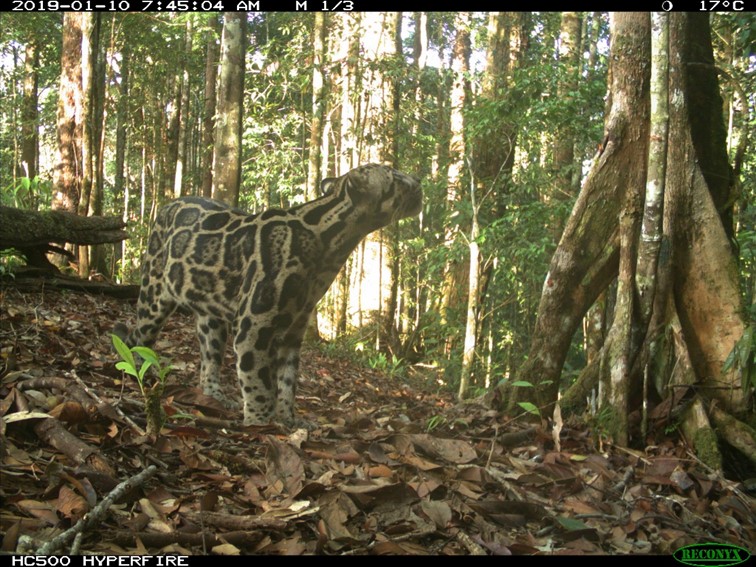
It doesn’t feel good to criticize other’s work: but this is how science advances. In Nature today we respond to a high-profile paper (by Brodie et al.,) about the impact of protected areas on wildlife in southeast Asia.
https://t.co/tKs869faLd
Enhanced geothermal expected to reach a levelized cost of $80/MWh by 2027, negating the need for any other form of baseload (looking at you, coal and nuclear).
Drop in costs because drilling times have declined by 50-70%.
https://t.co/qbnDD9zjx7
Save the date! Blue Carbon R library Workshop!
The BlueCarbon R library automate the estimation of soil carbon stocks and sequestration rates from laboratory data. We will host an online free workshop about the library functions and how to use them the 28th of January, 16:00 CET
The power of natural climate solutions! 🌴💪
1/2 land use carbon emissions in Southeast Asia can be mitigated through peat swamp and mangrove conservation/restoration
New research from @sdsasmito@NUSgeog@TulaneSSE@SueSep5@P_Taillardat@CathLovelock
https://t.co/w5qJXyZ7es
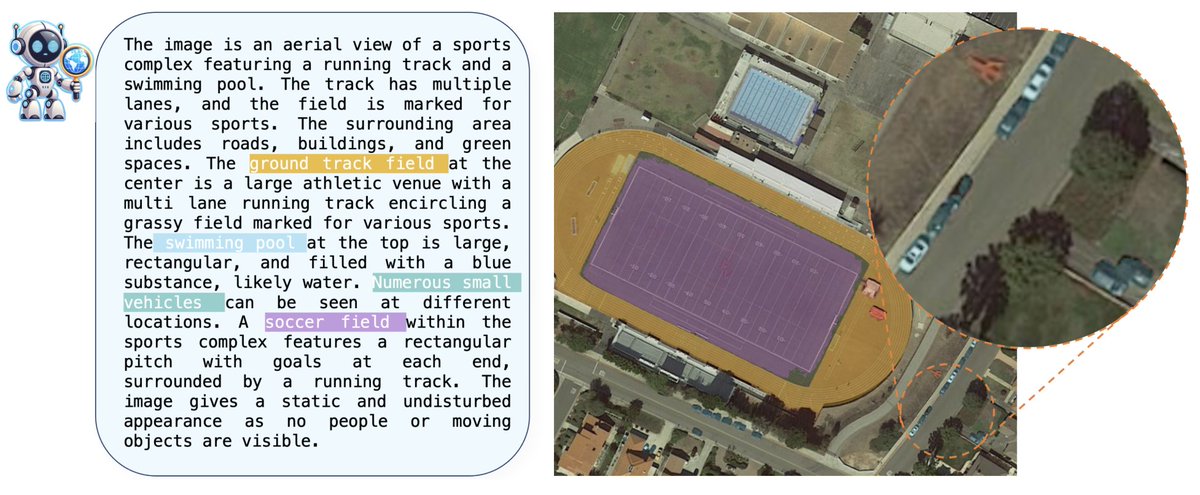
🚀 Glad to share our new vision-LLM capable of locating objects in high-res satellite/aerial imagery. We call it 𝗚𝗲𝗼𝗣𝗶𝘅𝗲𝗹 🌍 since it provides pixel-accurate object masks in high-resolution geospatial images. 🛰️✨
🌐 𝗣𝗿𝗼𝗷𝗲𝗰𝘁: https://t.co/QghocmBore
🧵1/5
In QGIS it's hard to get geoprocessing right the first time, if it's even possible to do it in just one step.
Now, Kue can learn from its own mistakes and plan multiple steps ahead. This makes questions that need multiple difficult geoprocessing algorithms possible to be answered only using AI, like this example in San Francisco:
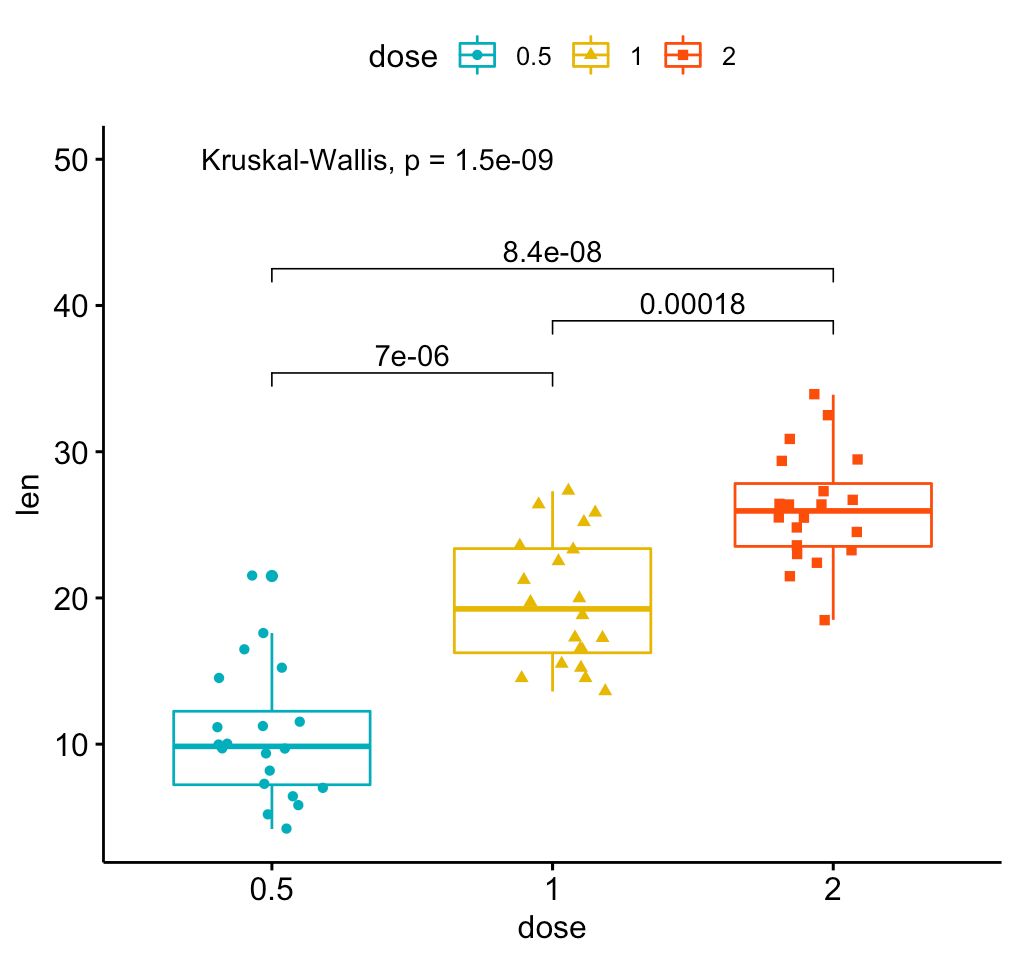
Create clear and informative box plots with added statistical insights using ggpubr! This package makes it easy to design polished plots that effectively showcase group comparisons and data distributions.
✔️ Visualize Group Comparisons: Box plots are ideal for comparing distributions across categories, showing medians, quartiles, and outliers. Combined with dot plots, they provide a detailed view of individual data points and variability.
✔️ Comprehensive Statistical Annotations: Add statistical comparisons, such as p-values and significance brackets, directly on the plot. The example here includes results from a Kruskal-Wallis test, with pairwise comparisons displayed above to indicate where significant differences exist between groups.
✔️ Customizable Design: Adjust colors, shapes, and labels to make your plots visually appealing and easy to interpret, ensuring they convey the right message.
✔️ Seamless Integration with ggplot2: Works directly with ggplot2, letting you build on your existing plots and enhance them with statistical details without the need for complex syntax.
The visualization shown here is from the package website, demonstrating how ggpubr can create polished, publication-ready plots with detailed statistical annotations: https://t.co/Dx49IJJnv5
Ready to master ggplot2 and its powerful extensions to create stunning visualizations? Enroll in my online course, “Data Visualization in R Using ggplot2 & Friends!”
See this link for additional information: https://t.co/ztlEzoEDWv
#DataViz #Rpackage #R #Statistical #DataAnalytics #RStats #ggplot2
Looking for mangrove or blue carbon researchers in
Brunei 🇧🇳
Cambodia 🇰🇭
Timor Leste 🇹🇱
for a collaborative manuscript.
Anyone on Twitter have some good recommendations? Preferably early career researchers.
cc: @Mangroves@MangroveProject@IUCN_Mangrove@mangrove
AnySat: An Earth Observation Model for Any Resolutions, Scales, and Modalities
@g_astruc@NicaoGr Clement Mallet @loiclandrieu
tldr: pretrains a multisensor & multimodal joint embedding network on GeoPlex dataset. achieves SOTA on a diverse set of time-series EO benchmarks
🎙️ New Podcast and YouTube episode: Deepness QGIS plugin with Marek Kraft
The Deepness QGIS plugin is a powerful tool that brings deep learning capabilities to QGIS. It allows users to seamlessly integrate deep learning models into their workflows without requiring specialized hardware like GPUs
https://t.co/bFNT0ZCRLK