THIS IS ABSOLUTELY INSANE.
If you had invested $14,000 in SanDisk $SNDK last year, you would have over $1 MILLION today.
SNDK is now up 7,500% in the last 14 months.
A huge chunk of downside liquidity has formed for $BTC.
There's a small liquidity cluster around $67,000 but the majority of liquidity is to the downside again.
With FOMC coming tomorrow, Bitcoin could see a correction.
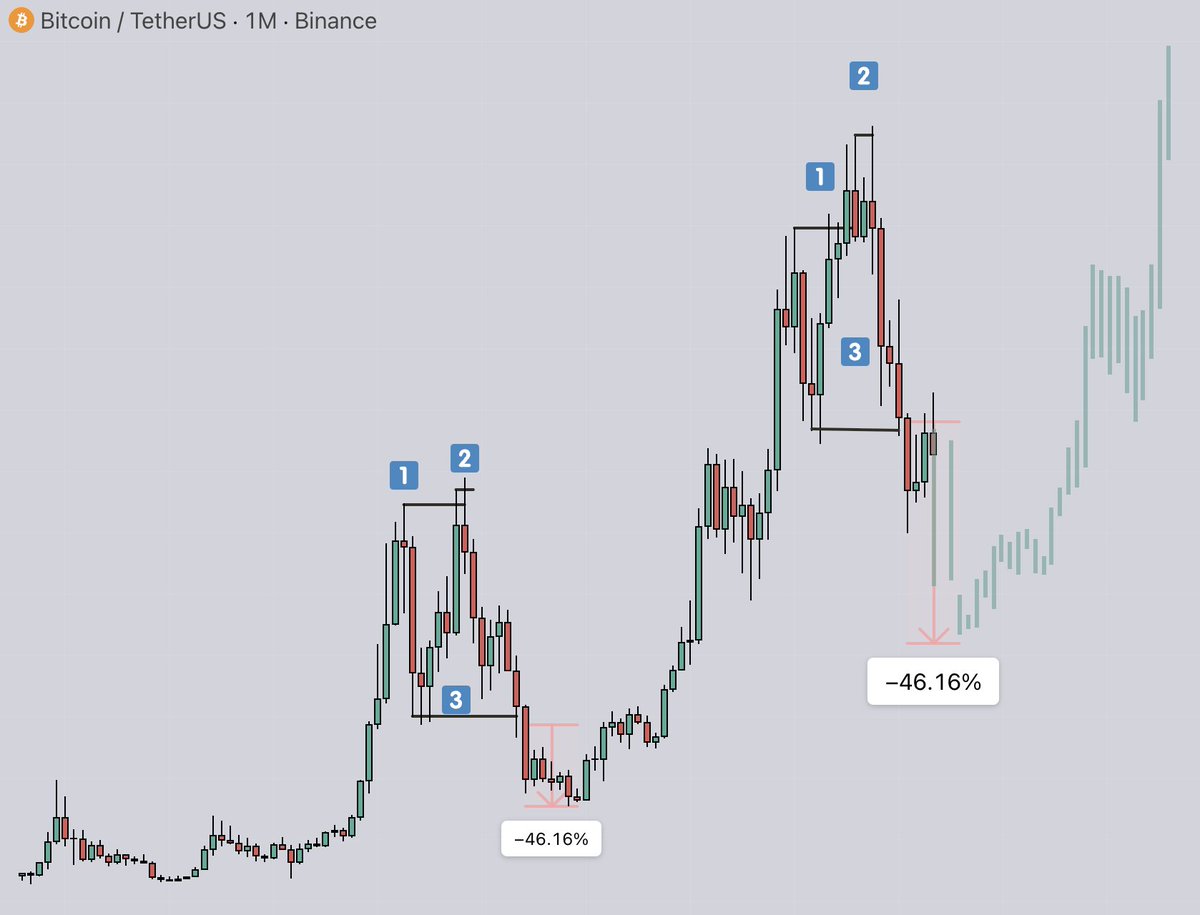
MY ONLY $BTC ROADMAP FOR THIS CYCLE!
July -> consolidation
August -> dump toward $50K
September -> ranging along the $50K lows
October -> bottom
November -> bounce
December -> bull market begins
Current bounce is exactly where most get caught, it feels like the bottom right before the worst drop
Then we'll have September, which closed red more than any other month in history, that's why the range holds.
And then final bottom in October
Notifs on and follow, will update you
New footage showing closeup of IDF soldier shooting a 7 month baby in the head, for fun.
This footage was obtained by B'Tselem Israeli human rights group.
This is how I see $BTC over the next months
June -> flat
July -> mini alt rally during bear
August -> dump to $50K
September -> fake bounce
October -> $40K bottom
November -> real bounce
December -> start of bull market
Bookmark this and come back at the end of the year.
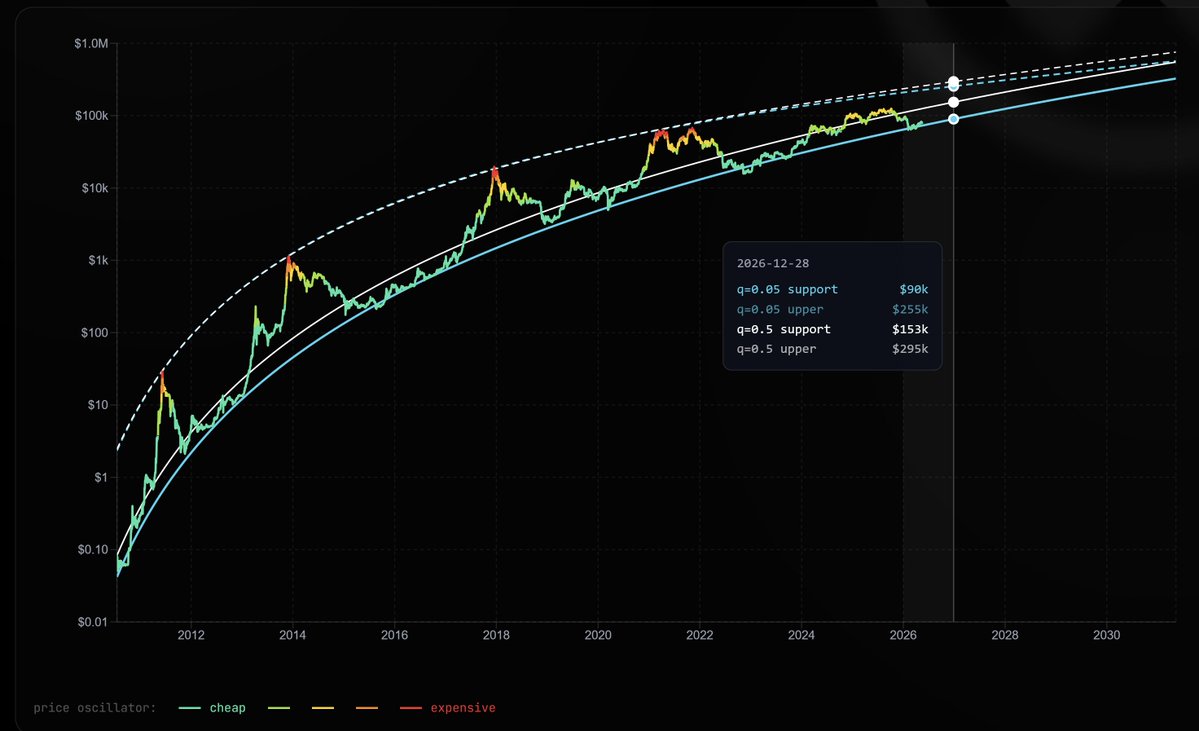
Bitcoin Decay Channel gives a pretty reasonable range - conservative case - of $90k - $255k by the end of this year. $128k - $308k for end of '27.
For comparison, Bitcoin was $43k in December 2023.
Tools like these help you avoid bubble-buying.
Coming soon @ sminstonwith. com.
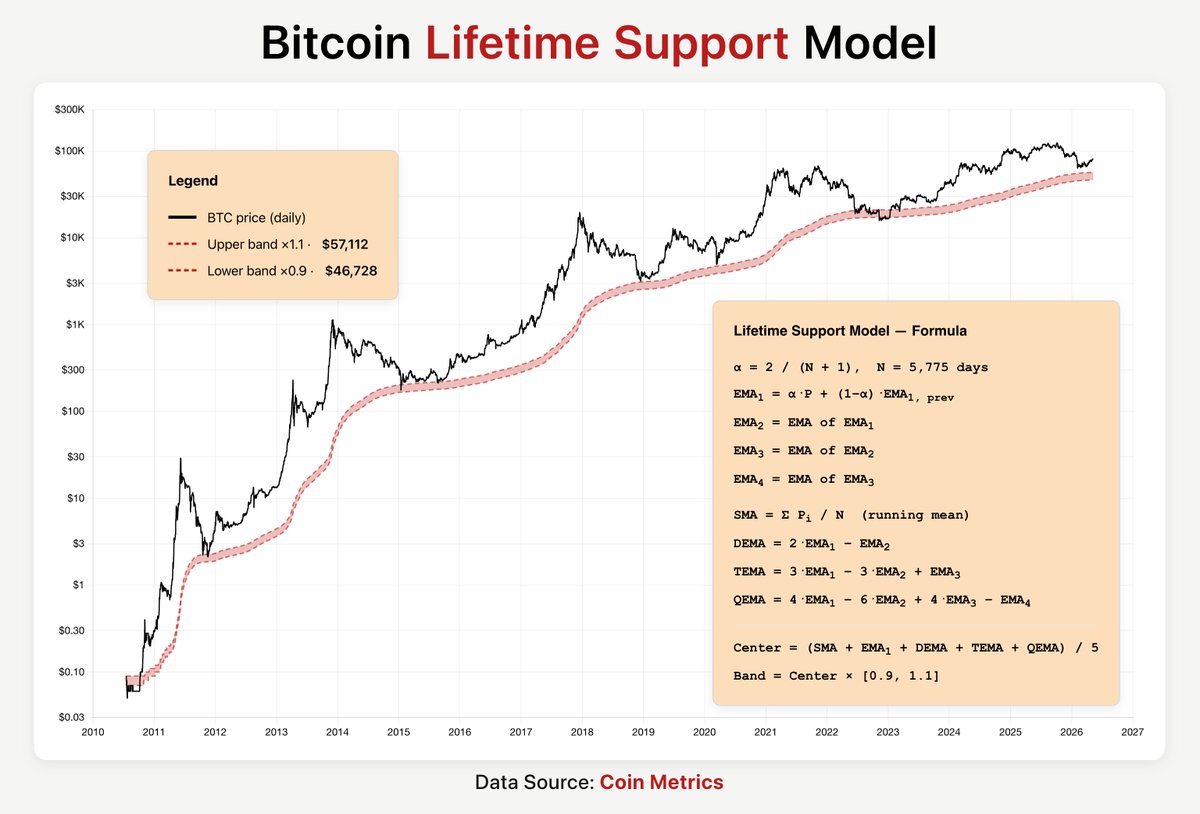
New Bitcoin Floor Model!
Simple and elegant.
Equal-weighted average of BTC's lifetime SMA, single EMA, double EMA (DEMA), triple EMA (TEMA), and quadruple EMA (QEMA), then plot a ±10% band around that average.
Upper band ×1.1 = $57,112
Lower band ×0.9 = $46,728
According to the average Bitcoin Bear Market time (391 days), the bear market is at 55% complete. We're 216 days in.
The lowest drawdown point is still -52%, about 25% higher than the previous cycle.
So, in a cycle that has shown no signs of changing, we are still not close to typical bear market drawdown percentages and are only a little over halfway through.
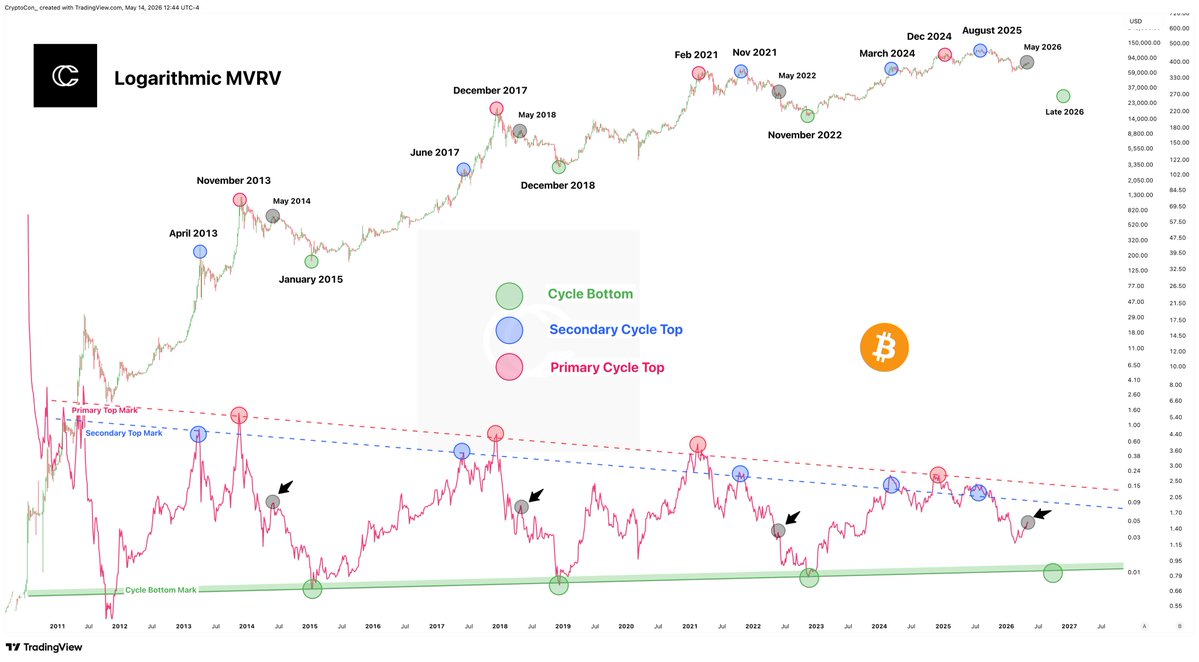
The business cycle narrative is back on the rise despite the clear failure late last year, which projected new highs for BTC. This is paired with bottom calls and claims the Havling Cycles Theory is dead... again.
Let's see what happens!
Bitcoin is now hitting a psychological resistance zone at $80,000.
This is another Bull Trap, and resistance will reject to $70,000 in a few days.
Then, $BTC will retest the bottom and dump to ~$40,000 in May.
Bookmark this chart - you’ll come back to it next week.
The next test for BTC is cleanly breaking the cost basis of recent investors (79k).
I give it 30% odds on doing this on this attempt. After that, if BTC manages to hold this price level above 65k and not break down, then the chances of a structural bottom increases significantly.
BTC is currently attempting a bottom, but all the pieces are not yet in place, the next 3-6 weeks will be telling.