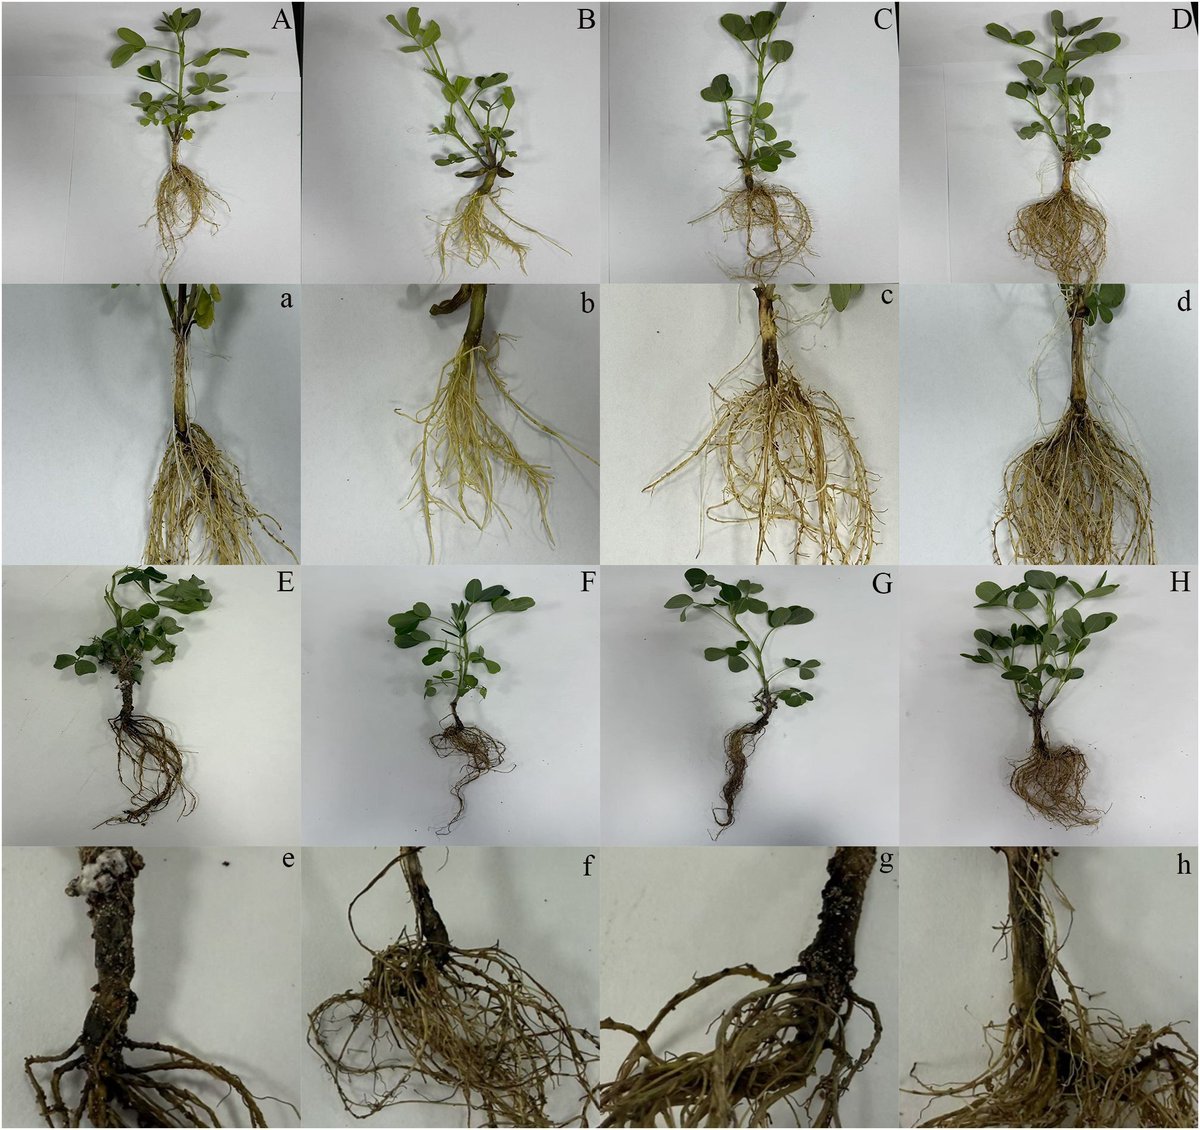
Les légumineuses à grains comestibles en Haïti : pilier de la sécurité alimentaire, la nutrition et la durabilité des systèmes agricoles
https://t.co/neIAZKwFX1
Generate the first draft of ANY type of literature review.
Use this FREE tool to do so.
Here’s how it works.
1. Visit https://t.co/sbnadJ1eRH and log in.
2. Select the 𝐿𝑖𝑡𝑒𝑟𝑎𝑡𝑢𝑟𝑒 𝑅𝑒𝑣𝑖𝑒𝑤 option from the menu and write your prompt.
#phd#literaturereview
University of North Carolina Library's detailed and free guide on how to conduct systematic reviews.
Covers:
• What is systematic review?
• Complete pre-review tasks
• Develop a protocol
• Conduct literature searches
• Manage citations
• Screen citations
• Assess quality of included studies
• Extract data from included studies
• Write the review
Follow Silvi on LinkedIn for more tips and free resources on systematic reviews and academic writing.
https://t.co/ZiyWUSxt7x
How to write the first draft of a literature review in 1 day?
Follow these 3 simple steps ⤵️
1. Go to https://t.co/ORJ7K7KOki
2. Enter the topic of your literature review
3. @updfeditor will generate draft of literature review
𝐖𝐡𝐚𝐭 𝐭𝐨 𝐝𝐨 𝐧𝐞𝐱𝐭? ⤵️
✦ Download the draft as MS Word file
✦ Check the list of references first
✦ Work on the draft to refine it
𝐃𝐨𝐧’𝐭 𝐟𝐨𝐫𝐠𝐞𝐭 𝐭𝐡𝐢𝐬 𝐨𝐧𝐞 𝐭𝐡𝐢𝐧𝐠 ⤵️
➟ Go back to the UDPF platform
➟ Convert the generated draft into a mind map
➟ Carefully go through the mind map
➟ Understand the literature review in a nutshell
Try it today for FREE: https://t.co/ORJ7K7KOki
Here's a downloadable PDF containing guidelines for writing a systematic review.
Download by clicking the link below.
Follow Silvi on LinkedIn for more tips and free resources on systematic reviews and academic writing.
https://t.co/cIlKEnfSvJ
🎓 Complete the course, get certified!
🤔 Understand the role of #EcosystemServices in livestock systems and earn a certificate from @FAO.
🐪🐷Start here ➡️ https://t.co/N0cPhBDlTD
Talk about an in-flight meal.
For the first time, researchers have captured rats hunting bats by grabbing them from the sky. Learn more: https://t.co/diTO1zqjUf @NewsfromScience
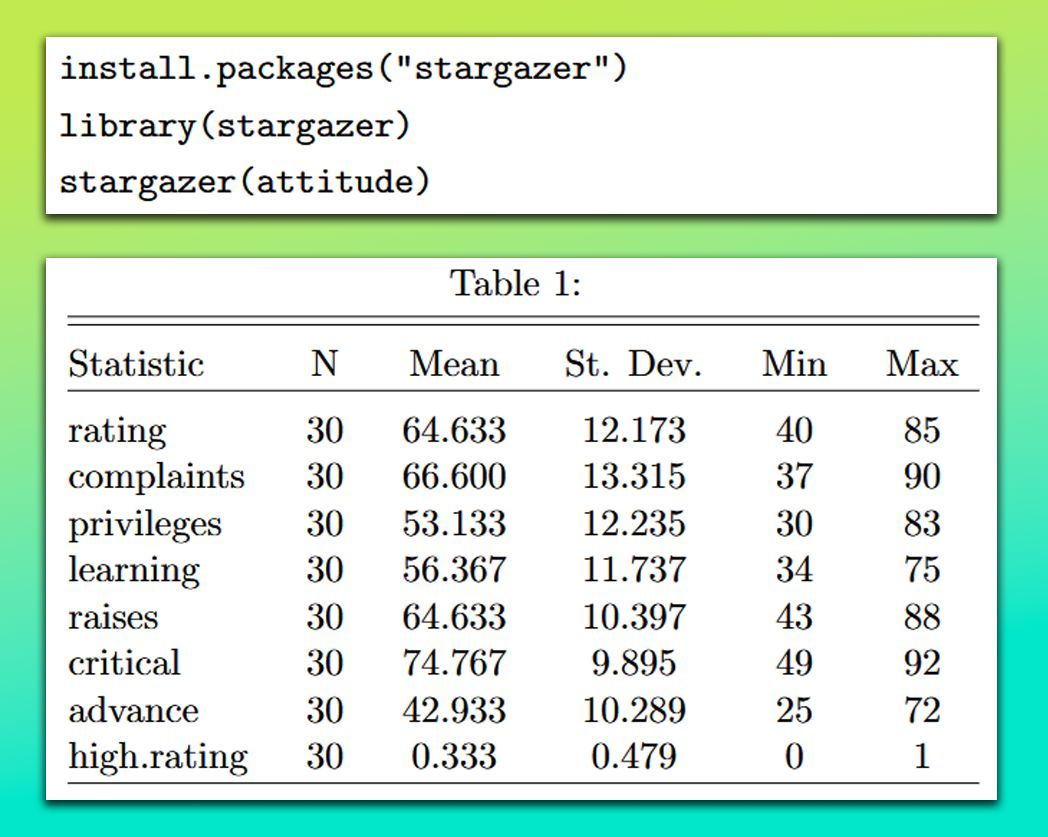
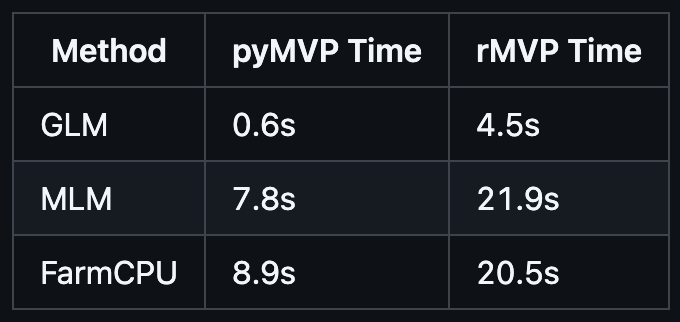
The stargazer package in R makes it simple to create well-formatted summary tables and regression outputs in LaTeX, HTML, or plain text. With just a few lines of code, you can transform your statistical results into clean, publication-ready tables—ideal for reports, papers, and presentations.
✔️ User-Friendly: Makes it easy to generate summary and regression tables with minimal code.
✔️ Supports Multiple Formats: Exports tables in LaTeX, HTML, and plain text for flexible reporting.
✔️ Customizable: Allows you to adjust captions, labels, significance stars, and other formatting options.
✔️ Handles Multiple Models: Can display results from several regression models side-by-side for easy comparison.
The image below shows a summary table generated by stargazer, presenting descriptive statistics like mean, standard deviation, minimum, and maximum for the attitude data set. The table’s clean layout makes it ready for direct use in reports. The content of this visualization is sourced from the package vignette: https://t.co/jYBTXWj9mu
Looking for more practical tips on Statistics, Data Science, R, and Python? Subscribe to my email newsletter! Learn more by visiting this link: https://t.co/X93SeCe0rb
#database #Rpackage #datastructure #datasciencetraining #datascienceeducation
PhD Students – Use this tool to generate the first draft of ANY type of literature review in 10 minutes.
Meet @answerthisio — a tool that makes literature review faster and easier.
Here’s how it works.
1. Visit https://t.co/lRjp6Ba6ho and log in.
2. Select the 𝐿𝑖𝑡𝑒𝑟𝑎𝑡𝑢𝑟𝑒 𝑅𝑒𝑣𝑖𝑒𝑤 option from the menu.
3. From the prompt helper, select 𝑊𝑟𝑖𝑡𝑒 𝑎 𝑙𝑖𝑡𝑒𝑟𝑎𝑡𝑢𝑟𝑒 𝑟𝑒𝑣𝑖𝑒𝑤 𝑜𝑛.
4. Enter your research topic in the blank text field
➝ For example, Vulnerabilities in Big Data Systems
5. Click 𝐶𝑟𝑒𝑎𝑡𝑒 to generate the initial search prompt.
6. Press Enter to see research filter options.
7. Choose your response type based on your needs.
➝ Structured Literature Review: Citation-rich and detailed.
➝ Dynamic Research Assistant: To explore research gaps.
➝ AI Only: Fast, but unreliable with no citations.
8. Set the minimum number of citations for the review.
➝ Choose at least 10 for comprehensive results.
9. Decide whether to enable 𝑇𝑢𝑟𝑏𝑜 𝑀𝑜𝑑𝑒 for faster results.
➝ Disabling it gives you more comprehensive answers.
10. Select the sources for search results.
➝ Choose both web and databases for thorough results.
11. Specify the date range to get recent papers.
12. Enable 𝑑𝑜𝑢𝑏𝑙𝑒-𝑐ℎ𝑒𝑐𝑘 𝑐𝑖𝑡𝑎𝑡𝑖𝑜𝑛𝑠 for accurate results.
13. Once filters are set, click 𝑆𝑢𝑏𝑚𝑖𝑡 𝑆𝑒𝑎𝑟𝑐ℎ to proceed.
14. After a while, your literature review will be generated.
➝ Sources and citations will be listed on the right.
15. Review the results and assess the paper sources carefully.
16. Add relevant papers to your library for easy access later.
17. Export citations in formats like BibTeX or CSV as needed.
18. You can also download the review as a Word or PDF file.
Treat this literature review as an initial draft.
Refine it and build your review on the top of it.
Ready to make literature review effortless?
Try @answerthisio (https://t.co/lRjp6Ba6ho) today and see the difference!
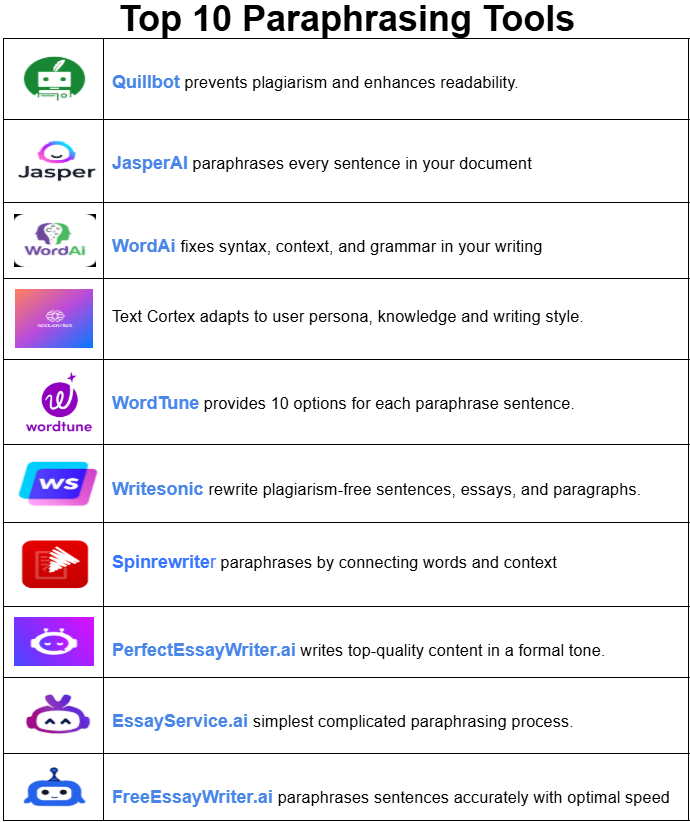
Top 10 Paraphrasing Tools
1. @quillbot
It is featured with advanced paraphrasing and grammar-checking tools. It preserves original meanings, prevents plagiarism and enhances readability while paraphrasing a sentence.
2. @thejasperAI
Its technology is based on the NLP technique that ensures that a sentence is paraphrased without losing its original meaning. Its text resembles human writing to a great extent.
3. @WordAi
This tool uses advanced algorithms and machine learning techniques to understand syntax, context and grammar. It paraphrases content that is coherent and contextually accurate.
4. @TextCortex
It is an AI-driven paraphrasing tool for academic writers who use its fully personalized AI model (adaptable to persona, knowledge, and style) and convert ideas into high-quality content.
5. @wordtune
Its rewrite model is a super helpful tool as it works well with disjointed and ungrammatical text. It provides 10 options for each paraphrase to choose from its user-friendly interface.
6. @WriteSonic
This paraphrasing tool rewrite plagiarism-free sentences, essays, and paragraphs. Set a formal writing tone with content personalization and paraphrase tons of paragraphs instantly with a bulk upload option.
7. @spinrewriter101
This tool uses Emulated Natural Language (ENL) technology to understand the relationship between words and context. Its generated text is highly readable and mirrors human accuracy.
8. @essaywriterai
It is an ideal paraphrasing tool for PhD students and researchers who can help you write top-quality content in a formal tone without compromising academic integrity.
9. https://t.co/toAPWnoKoN
It is a top-rated paraphrasing tool among researchers because it helps you streamline the paraphrasing process so that every paraphrased paragraph retains its original meaning.
10. @FreeEssayWriter
It is a useful tool for paragraphing content with speed and accuracy among researchers and students who need a budget-friendly option.
Any other tool you'd like to add?
7 Sci-Hub Alternative Websites
Paper you need to ask for payment & can't use sci-hub?
You don't have to pay to read academic papers.
These are 7 sci-hub alternative websites to download papers for free.
👉 Unpaywall --> https://unpaywall. org/
Install this browser extension on Chrome and read the paper directly on the journal website legally and for free.
👉 Open Access Button (OAB) --> https://lnkd. in/dXVVQpUf
Copy and paste the link paper or DOI on the OAB website. This will be accessible on the next page. Legal.
👉 PaperPanda --> https://paperpanda. app/
Like Unpaywall, this Chrome extension allows you to access millions of research papers in one click.
👉 DOAJ --> https://doaj. org/
As the name implies, DOAJ (Directory of Open Access Journals) provides access to millions of scientific papers from around the world for free.
👉 OA[.]mg--> https://oa. mg/
Like Google which is made specifically to search for academic papers. There are more than 250 million papers available for access.
👉 Core --> https://core. ac. uk/
The world's largest database of research papers with more than 298 million papers from around the world that can be accessed for free.
👉 arXiv --> https://arxiv. org/
Especially for lovers of natural sciences and economics, this website provides access to 2.4 million academic papers for free.
Tip: Remove any spaces in the URLs if you encounter issues accessing the websites.
Looking to effortlessly merge multiple ggplot2 plots into one seamless graphic? The patchwork package simplifies the process of arranging and aligning plots, letting you present your data in a more cohesive and informative way.
✔️ Easy Layouts: Arrange several plots in different configurations with simple operators, avoiding the need for complicated code.
✔️ Customizable Designs: Fine-tune spacing, alignment, and layout to create polished visuals that match your presentation style.
✔️ Combine Different Plot Types: Mix various kinds of plots to highlight multiple aspects of your data in a single, unified display.
✔️ Seamless Integration: Built to work smoothly with ggplot2, using the same familiar syntax and tools.
The example visualization is from the package website and illustrates how patchwork can effortlessly combine multiple plots into one: https://t.co/PKEDNGuX7o
To learn more about ggplot2 and how to craft compelling visualizations, check out my online course, “Data Visualization in R Using ggplot2 & Friends!”
Click this link for detailed information: https://t.co/ztlEzoEDWv
#Statistical #RStudio #datavis #RStats
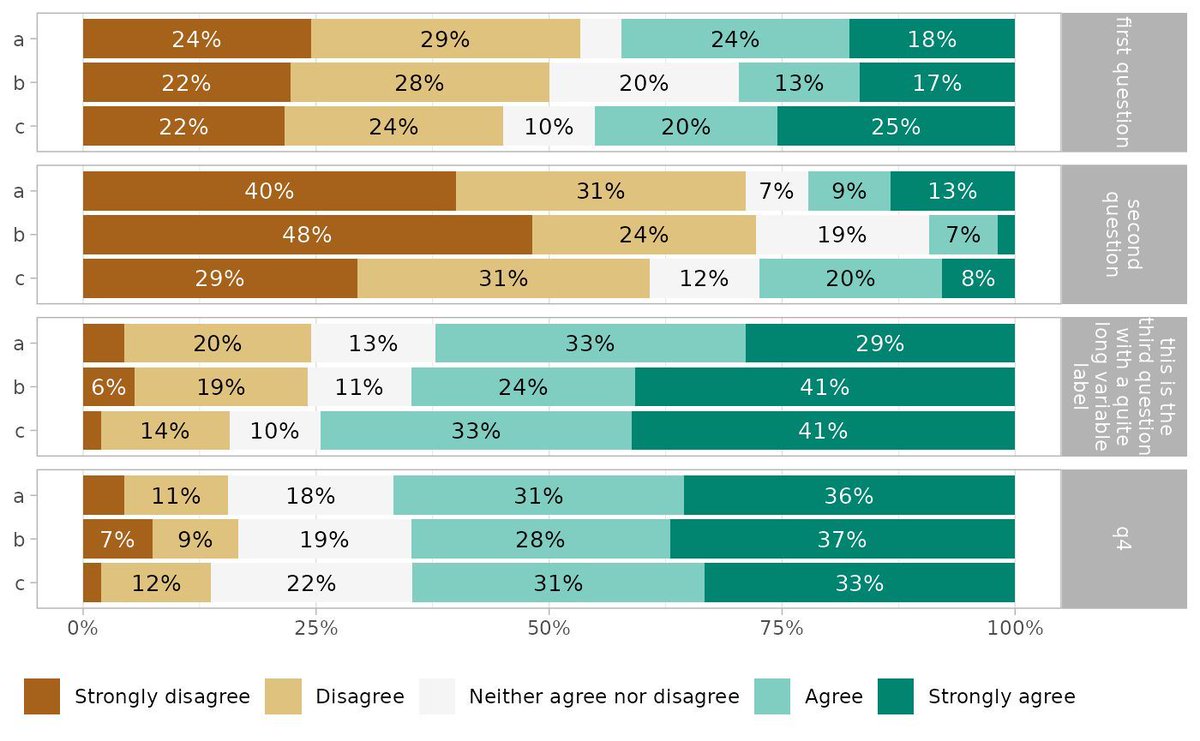
Visualize Likert-type survey data with ease using ggstats and its gglikert() function. Whether you're analyzing responses to survey questions or exploring patterns in attitudes and opinions, gglikert() provides a clear and effective way to represent Likert-scale data in R.
Why use gglikert()?
✔️ Tailored for Likert data: Specifically designed to handle Likert-type items, ensuring a structured and interpretable visualization.
✔️ Detailed insights: Displays distributions of responses, making it easier to understand trends and group differences.
✔️ Customizable plots: Leverages ggplot2’s flexibility to adapt the appearance to your needs and preferences.
The visualization included here originates from the ggstats documentation, showing how gglikert() can transform survey data into meaningful insights: https://t.co/ZrEMomuMWm
Want to take your data visualization skills further and explore tools like ggplot2 and its extensions? Check out my online course, "Data Visualization in R Using ggplot2 & Friends!"
For more information, visit this link: https://t.co/ztlEzoEDWv
#RStats #DataVisualization #DataViz #DataAnalytics #tidyverse #Rpackage
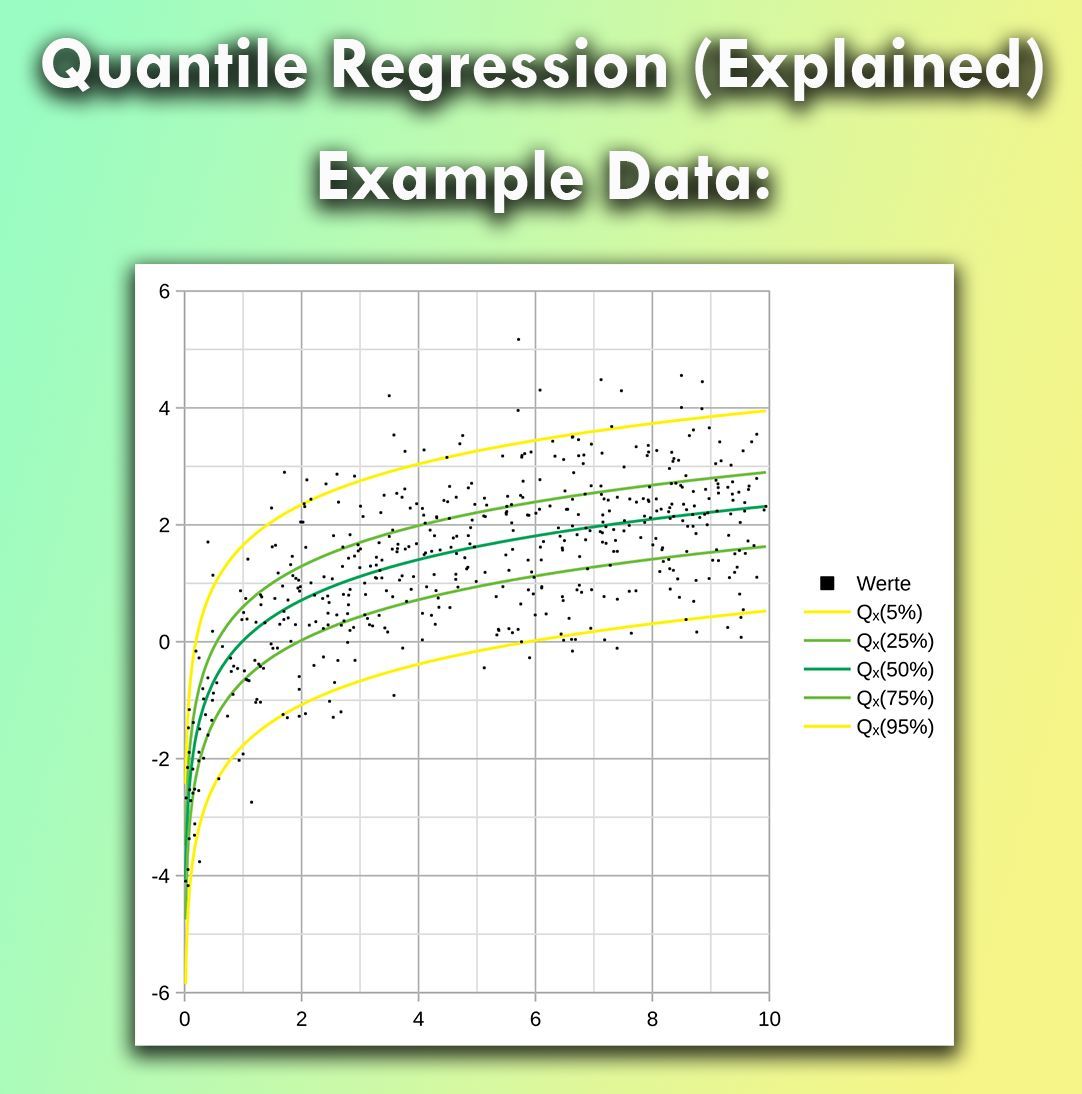
Quantile regression is a valuable tool for analyzing the relationship between variables, especially when data is not evenly distributed or has outliers.
Unlike traditional linear regression, which focuses only on the mean, quantile regression allows us to predict different points across the distribution of the target variable.
Challenges:
❌ Compared to linear regression, quantile regression requires more computational power and can be harder to interpret for non-experts.
❌ Larger sample sizes might be needed to achieve stable and reliable quantile estimates, especially for extreme percentiles.
❌ The model's results might be less intuitive if you are accustomed to traditional regression techniques, which could limit ease of communication.
Advantages:
✔️ Quantile regression helps to explore trends at various quantiles, offering a more detailed picture of your data.
✔️ This method is highly effective for non-normal data, particularly when there are outliers or heavy tails.
✔️ It is ideal for situations where extreme values or various percentiles are as important as the central trend.
How to handle quantile regression in practice:
🔹 R: Use the quantreg package to apply quantile regression. The rq() function allows you to specify the quantiles you're interested in.
🔹 Python: In Python, statsmodels provides quantile regression with the QuantReg() function to analyze different percentiles of your data.
The attached visualization is based on a Wikipedia image (link: https://t.co/AESkeL5pg0) and illustrates quantile regression lines at various percentiles, showing how predicted values differ across the distribution.
To explain this topic in further detail, I collaborated with Micha Gengenbach to create a comprehensive tutorial: https://t.co/oJnspCYzC3
Curious to learn more about statistics and R programming? Join my online course, "Statistical Methods in R." Check out this link for more details: https://t.co/7YQCRDKSPO
#RStats #database #Rpackage #Statistics #RStudio #statisticians #Data
#dataviz#maps A code demonstration and tutorial on using power of #R, {sf} & {terra} for techinques of raster extraction. Getting elevations and land use on points, routes and areas.
Code 🔗 https://t.co/ZTTrZBNLB1
Tools #rstats#sf#ggplot2#terra#tidyterra by @dhernangomez


![ScholarshipfPhd's tweet photo. 7 Sci-Hub Alternative Websites
Paper you need to ask for payment & can't use sci-hub?
You don't have to pay to read academic papers.
These are 7 sci-hub alternative websites to download papers for free.
👉 Unpaywall --> https://unpaywall. org/
Install this browser extension on Chrome and read the paper directly on the journal website legally and for free.
👉 Open Access Button (OAB) --> https://lnkd. in/dXVVQpUf
Copy and paste the link paper or DOI on the OAB website. This will be accessible on the next page. Legal.
👉 PaperPanda --> https://paperpanda. app/
Like Unpaywall, this Chrome extension allows you to access millions of research papers in one click.
👉 DOAJ --> https://doaj. org/
As the name implies, DOAJ (Directory of Open Access Journals) provides access to millions of scientific papers from around the world for free.
👉 OA[.]mg--> https://oa. mg/
Like Google which is made specifically to search for academic papers. There are more than 250 million papers available for access.
👉 Core --> https://core. ac. uk/
The world's largest database of research papers with more than 298 million papers from around the world that can be accessed for free.
👉 arXiv --> https://arxiv. org/
Especially for lovers of natural sciences and economics, this website provides access to 2.4 million academic papers for free.
Tip: Remove any spaces in the URLs if you encounter issues accessing the websites.](https://pbs.twimg.com/media/Gl6KaSsXUAAXLtW.png)