Check out our soon-to-be-released USDM graphic, which will be available in the CropProphet Enterprise interface.
This GIF shows corn-growing counties by U.S. Drought Monitor-defined drought level.
The animation filters counties by corn production share, starting with all corn-producing counties and narrowing in 10% increments to the top 10% of corn-producing counties.
Try CropProphet: https://t.co/KDIUNOWbzt
#OOTT #AgWx #AgWeather #USDM
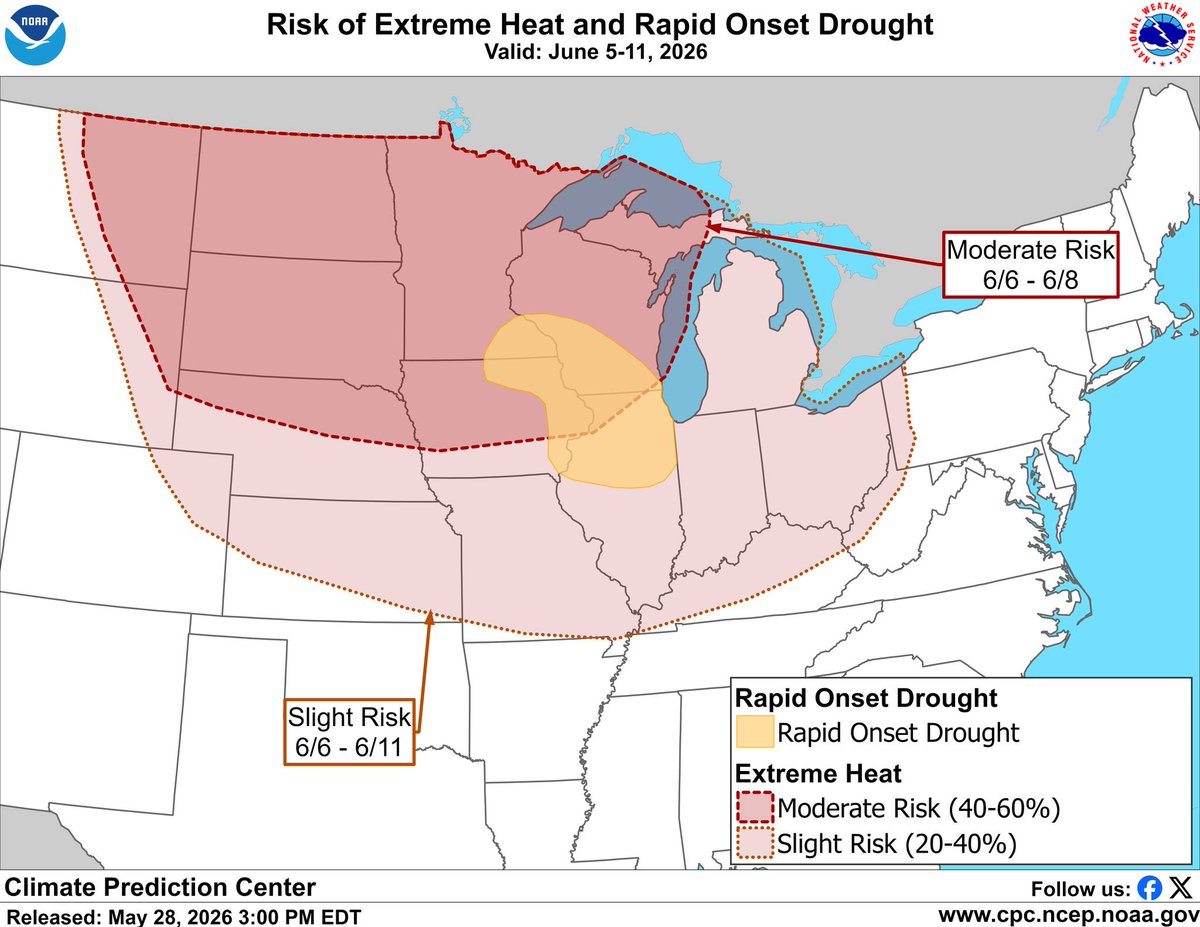
NOAA's Climate Prediction Center flagged a moderate risk of extreme heat with a Rapid Onset Drought risk designated across portions of the central Corn Belt for June 5-11.
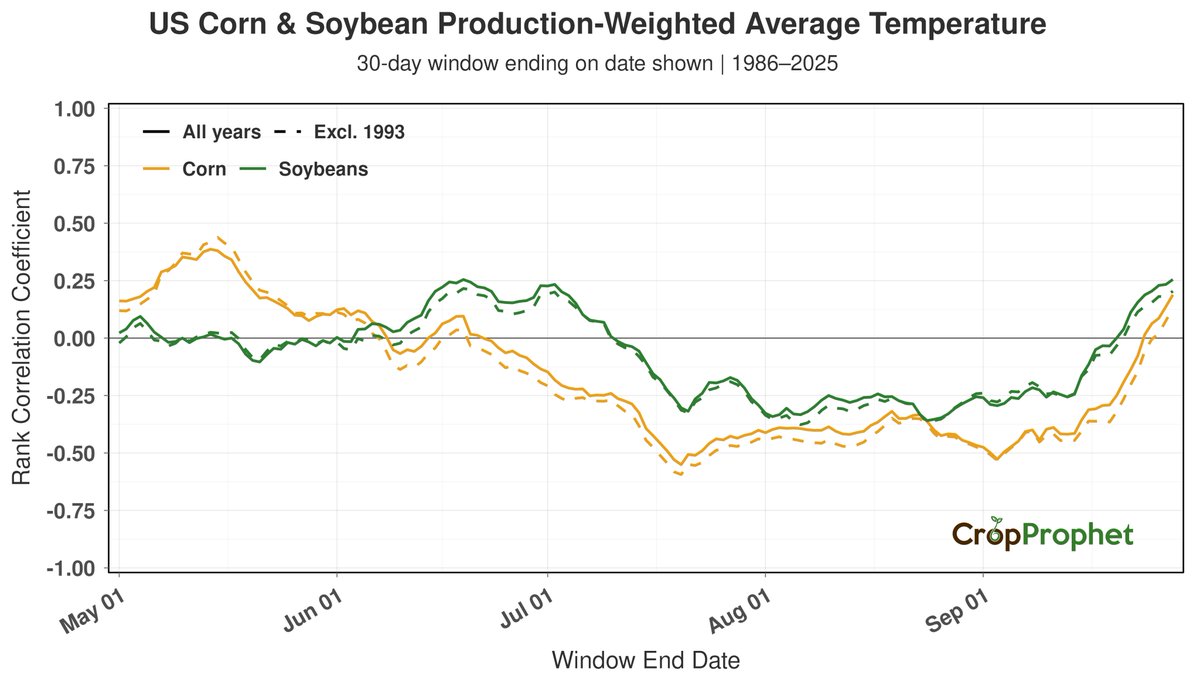
This may not be bad news for corn yields right now. CropProphet's 1986-2025 analysis (rank correlation of the 30-day production-weighted average temperature vs. end-of-season corn yield, plotted by window end date) shows the relationship is positive for windows ending in May through early June, roughly neutral for windows ending mid-to-late June, then turns sharply negative for windows ending in July, when heat becomes a clear yield drag.
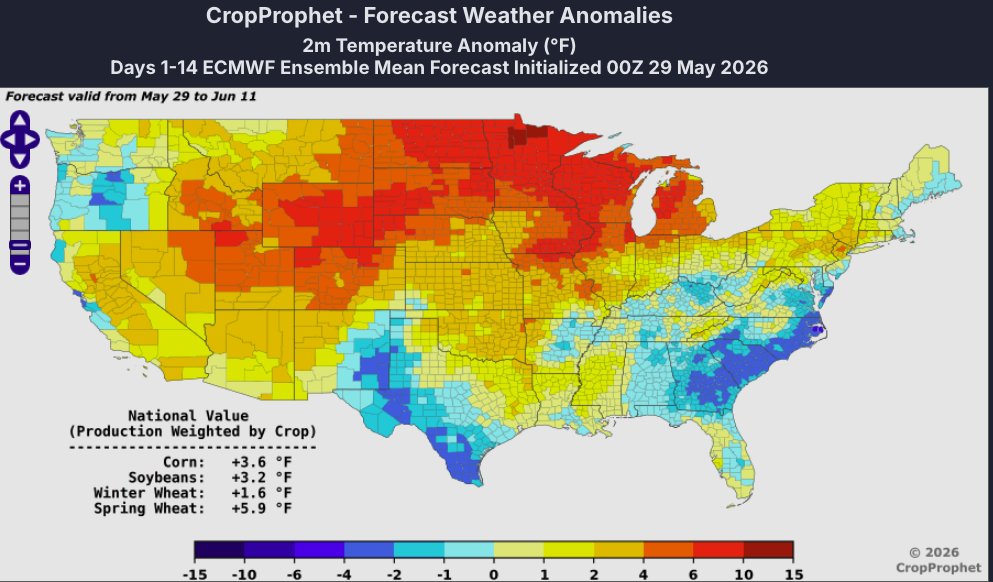
Today's 00Z 14-day ECMWF and AIFS forecasts show above-normal US corn production-weighted average temperatures of +3.6°F and +5.3°F respectively.
Heat in May/early June and heat in July are not the same story for corn.
#OOTT #Corn #Ags #Wx #AgWx #AgWeather #CPC
Today's 00z ECMWF, AIFS, and GEFS all forecast below normal US corn production-weighted precipitation over the next 14 days.
• ECMWF: 56% of normal
• AIFS: 51% of normal
• GEFS: 59% of normal
We are now in the US weather market season. It is time to start monitoring the weather forecasts more closely.
#OOTT #AgWx #AgWeather #Corn #CornBelt
@kevinnohman@AegisCipherHq Interestingly, I recieved a response w/in a minute. My request was reviewed and I recieved an email in response. Now, I just need an response to my email response.
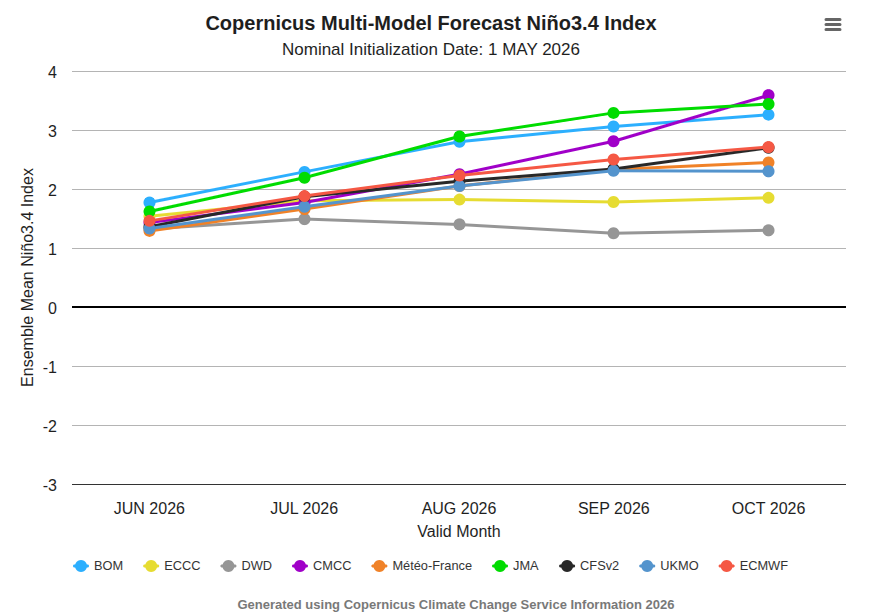
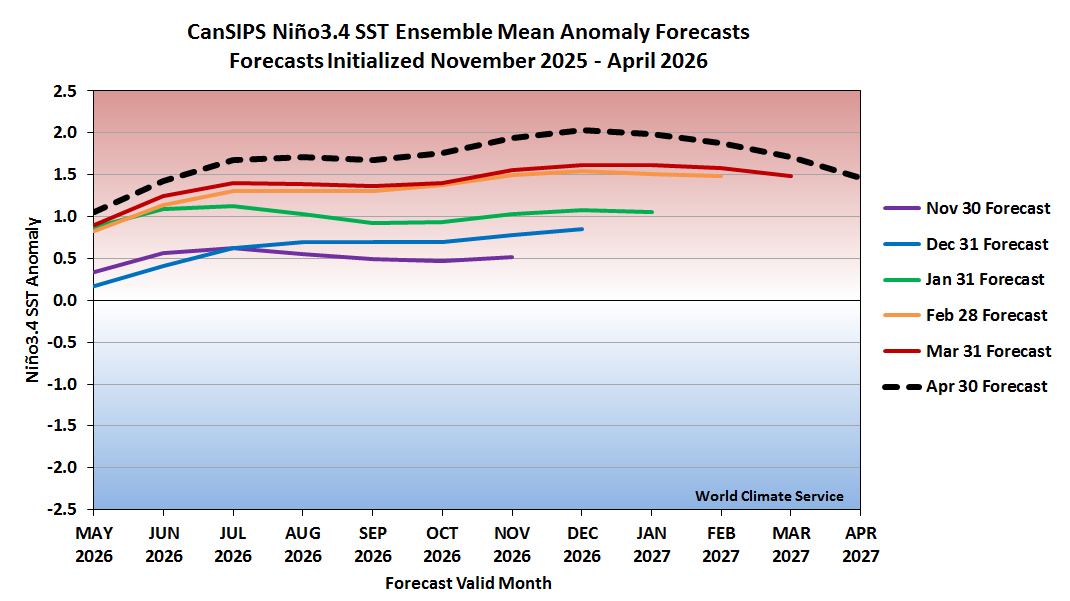
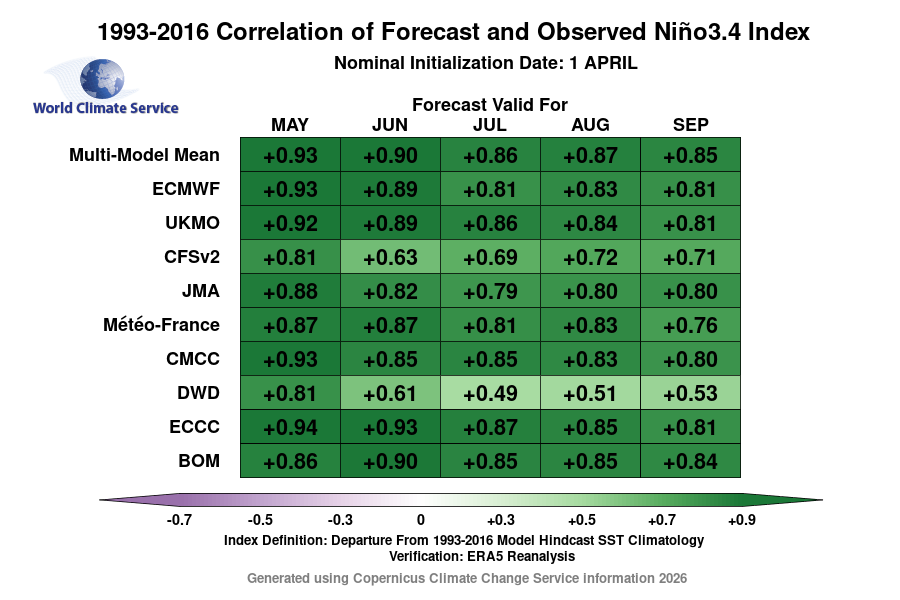
While the amplitude of the latest El Niño forecasts is a worthy headline, the latest C3S models show more variance than last month - both for traditional and relative Niño3.4 SSTs.
All models have warmed, but some much more than others.
(DWD is less credible - poor skill)
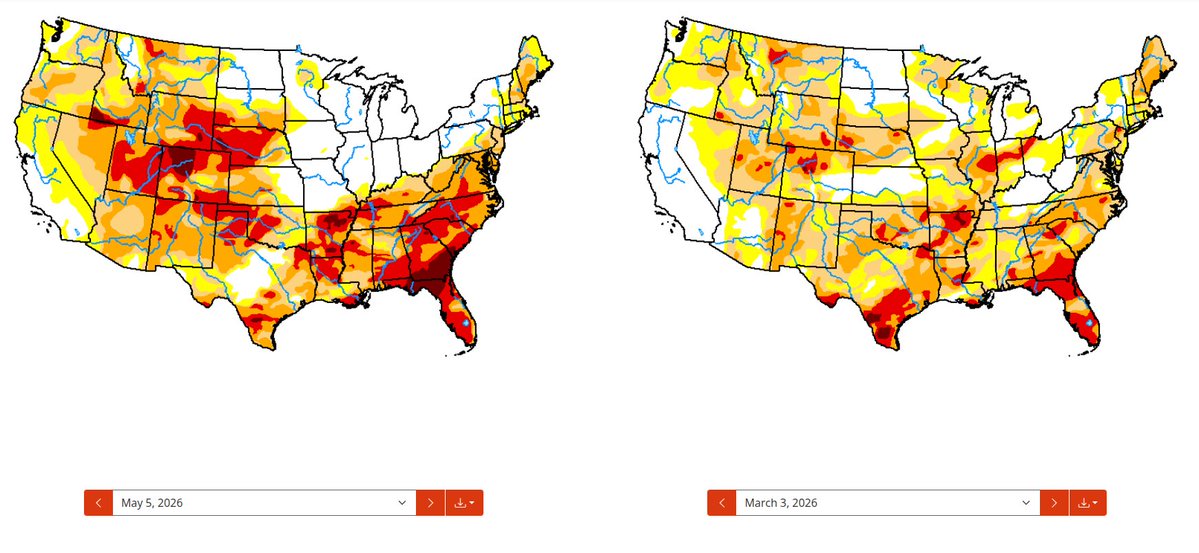
Good news as the U.S. Midwest growing season gets under way: drought/dryness have all but disappeared in the heart of the Corn Belt in the last two months, even as the Plains and Southeast have been very dry.
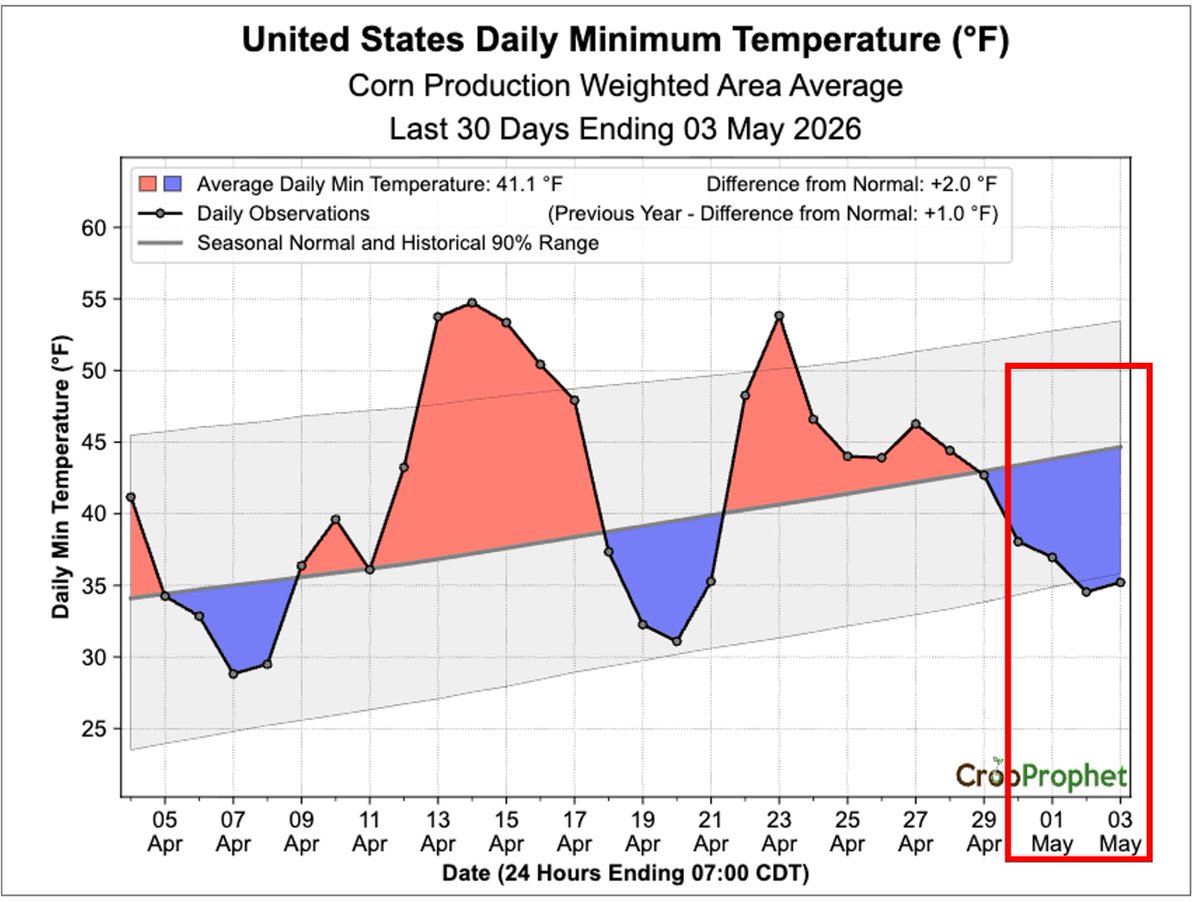
Minimum temperatures have been notably cold relative to 1981–2025 historical values since April 29 on a U.S. corn production-weighted basis.
Over the last 7 days, Nebraska and South Dakota corn production-weighted minimum temperatures have ranked much colder relative to history than Ohio.
The most comparable U.S. years for this period in 2026 include 1996 and 1984.
#oatt #AgWx #AgWeather #Corn #Plant2026 #Frost #Freeze
Minimum temperatures have fallen outside the 90% historical range over the past two days on a U.S. corn production-weighted basis.
Notably below-normal minimum temperatures are forecast to persist across U.S. corn production regions over the next 1 to 10 days.
Let us know in the comments whether frost has impacted you.
#OATT #AgWx #AgWeather #Corn #Frost #Plant2026
Yet another leg up in today's CanSIPS Niño3.4 forecast update.
The ensemble mean shows 9 months above +1.5°C anomaly. The ERSSTv5 record (1991-2020 baseline) is 8 consecutive months in 1997-98 and 2015-2016.
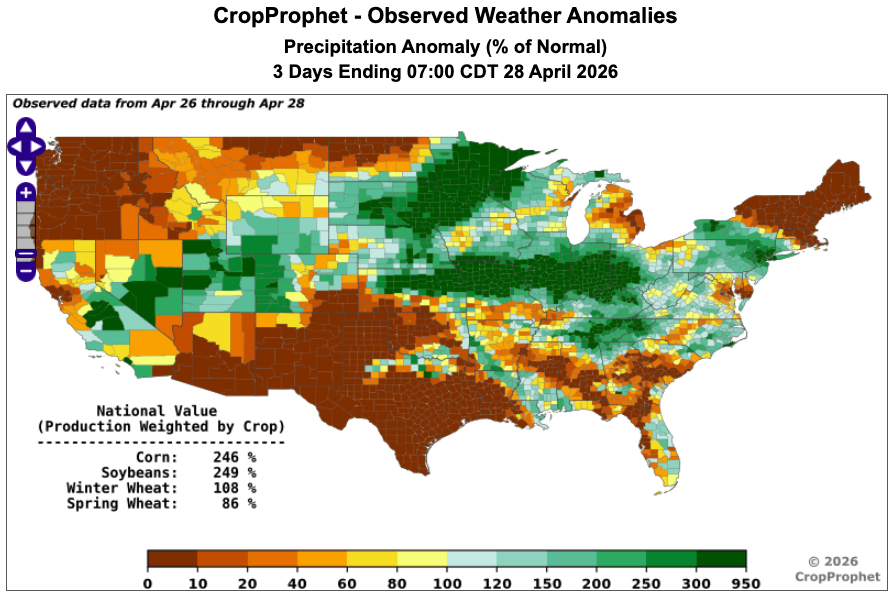
Heavy precipitation has impacted northern Missouri, Illinois, Indiana, and western Ohio over the past 3 days.
Some counties have received over 400% of normal precipitation during that time period.
The good news is that the AIFS is predicting notable dry conditions over the next 2 weeks for the corn belt.
#oatt #AgWx #AgWeather #Corn #Plant2026
With U.S. corn planting underway, current March through May U.S. corn production-weighted cumulative precipitation for 2026 is tracking above climatology and above many historical years shown in the 1981 to 2025 background distribution.
The chart also indicates that the 00z ECMWF forecast would keep cumulative precipitation rising over the next 14 days, maintaining a wetter-than-normal pattern relative to climatology.
Follow our Twitter feed for additional updates on weather conditions affecting the 2026 U.S. growing season.
#oatt #AgWx #AgWeather #USDA #Corn #Plant2026
Here is a map showing the predicted 2026 first corn planting date for each state, based on a state-level median regression estimate.
Several southern states may already have recorded their first non-zero USDA corn planting progress report date.
Over the next several weeks, most remaining corn-reporting states are projected to reach their first corn planting date.
#oatt #AgWx #AgWeather #Corn #Plant2026