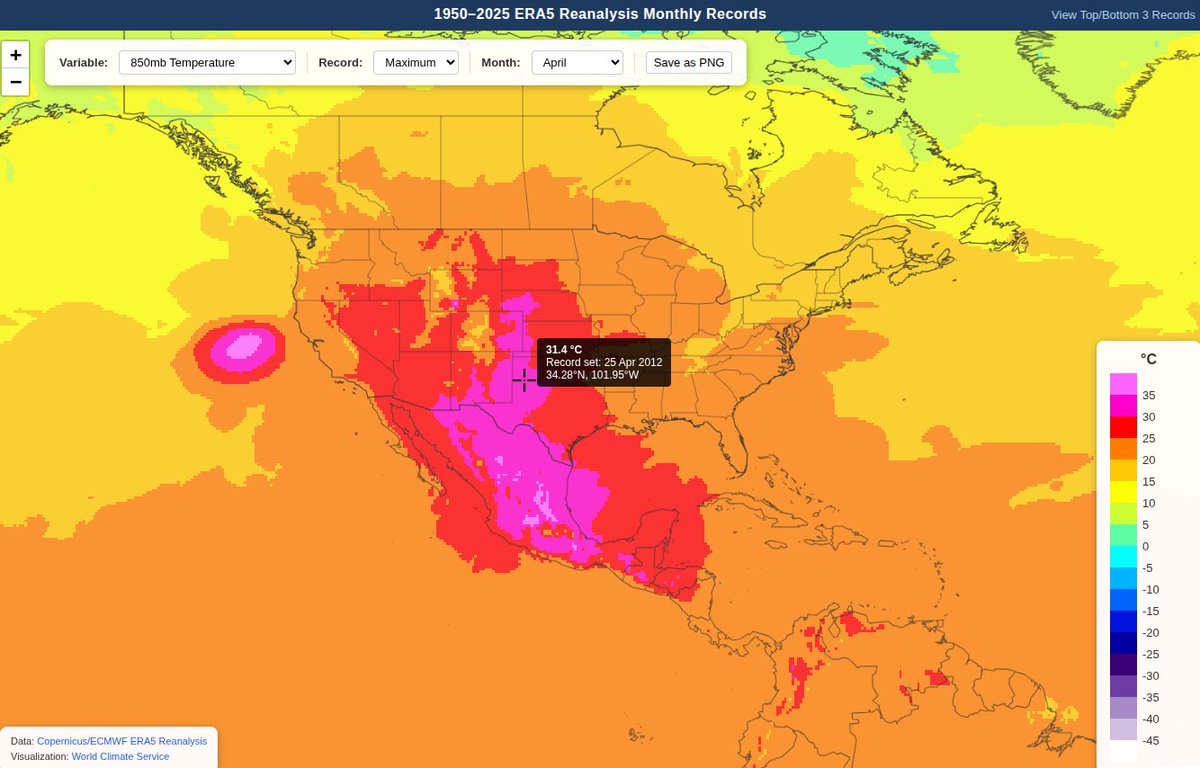
March, April, and perhaps even May monthly records will fall next week in the historic western U.S. heat wave.
Here's a tool to query ERA5 monthly/annual records for a few variables
https://t.co/EiEztXk5Q0
Climate curiosity: Utqiaġvik (formerly Barrow) Alaska has not yet reached 32°F/0°C this year, the latest since at least 1955.
The month of May was notably cooler than normal over Alaska and the Arctic Ocean to the north, yet Arctic-wide sea ice extent remains near a record low.
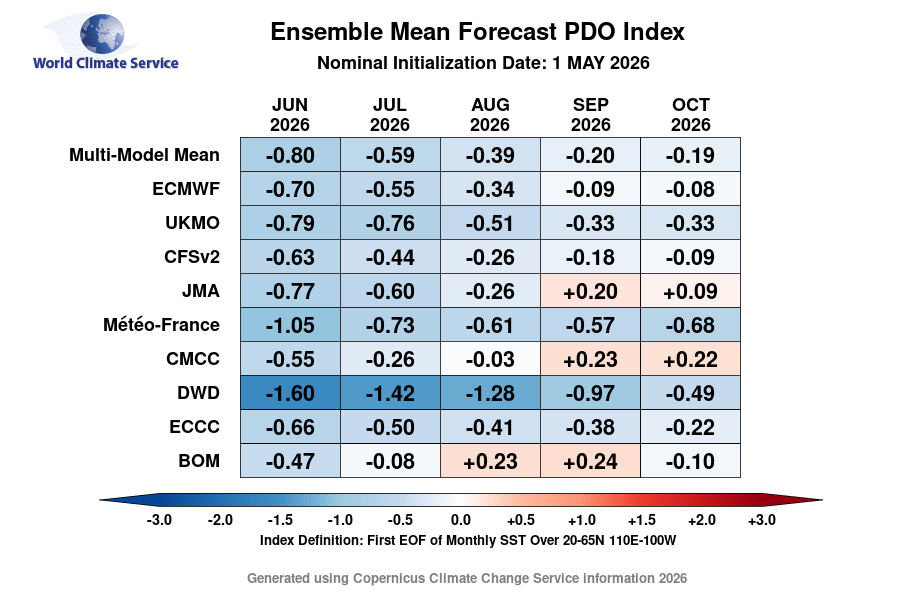
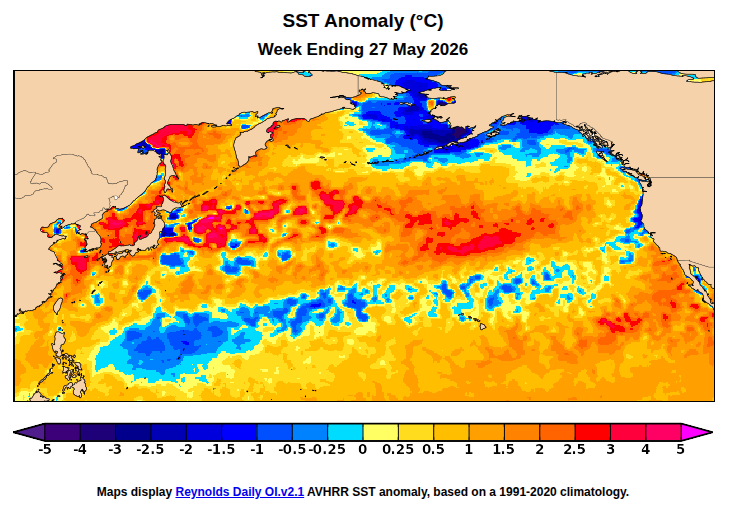
Interesting to see the PDO drifting back into more significantly negative territory.
The seasonal models have been trending in the opposite direction with some hints of a positive phase by autumn - but that seems less likely now.
The CFSv2 members used for Copernicus this month were in the middle of the pack for El Niño intensity by October.
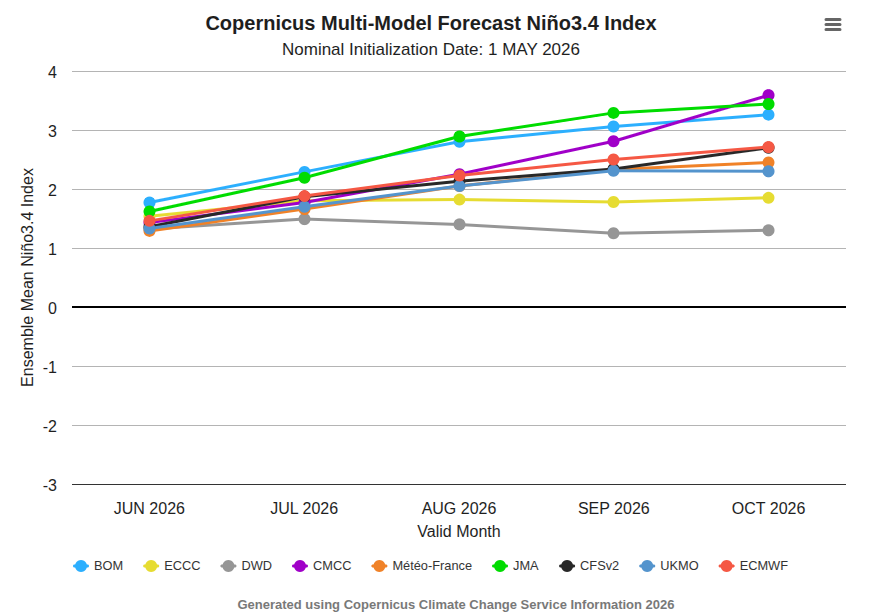
Since then, the forecast has continued to amplify, with (10-day lagged) ensemble mean SSTs now locally reaching +4.7°C above the 1991-2020 normal in Oct-Dec.
Fascinating study from Texas A&M here. There is a link between urbanization and rainfall. Has implications on planning, mitigation, and near-term forecasting.
News article on the paper here: https://t.co/LvpfOkd3Wu
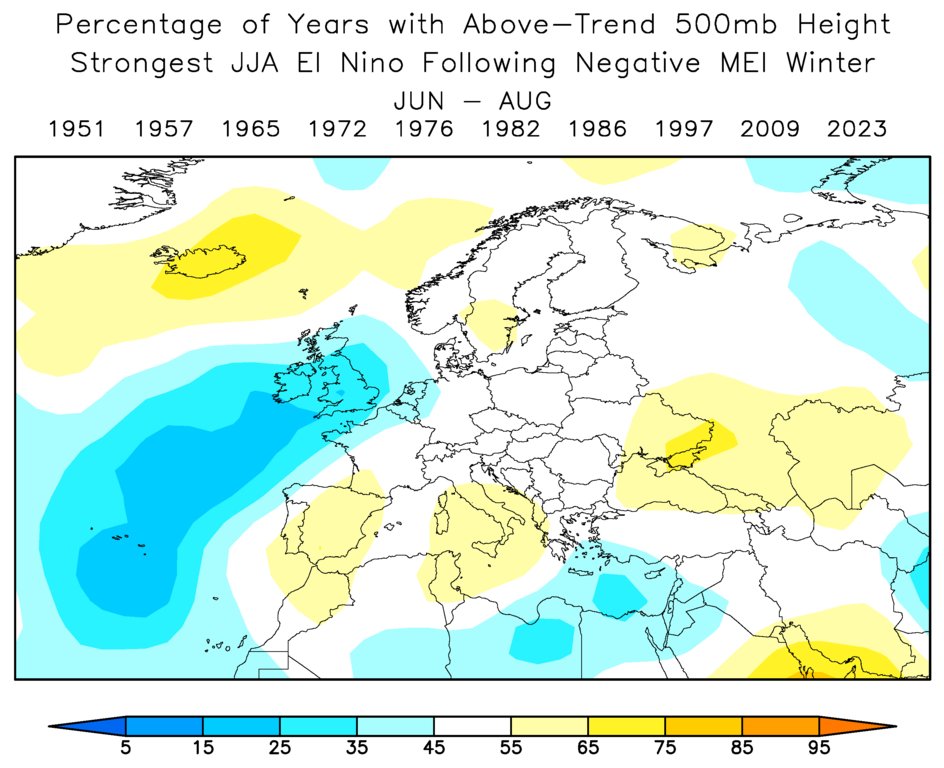
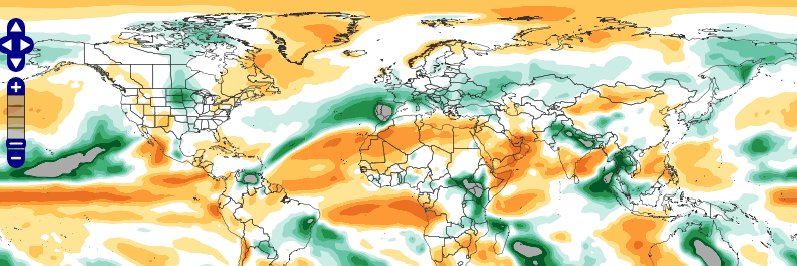
This spring's North Atlantic SSTs are quite similar to the MCA pattern that correlates with summer troughing to the west of Europe (Gastineau & Frankignoul 2015).
Interestingly *tropical* SST analogs point in the same direction.
Very different from the Copernicus consensus.
Herramienta fascinante para explorar el clima del pasado: Weather Replay, la nueva app de @CopernicusECMWF, permite reconstruir las condiciones meteorológicas de cualquier lugar del mundo hora a hora desde 1940 hasta hoy.
(Ver hilo)
Portal aqui: https://t.co/d2858leiB7
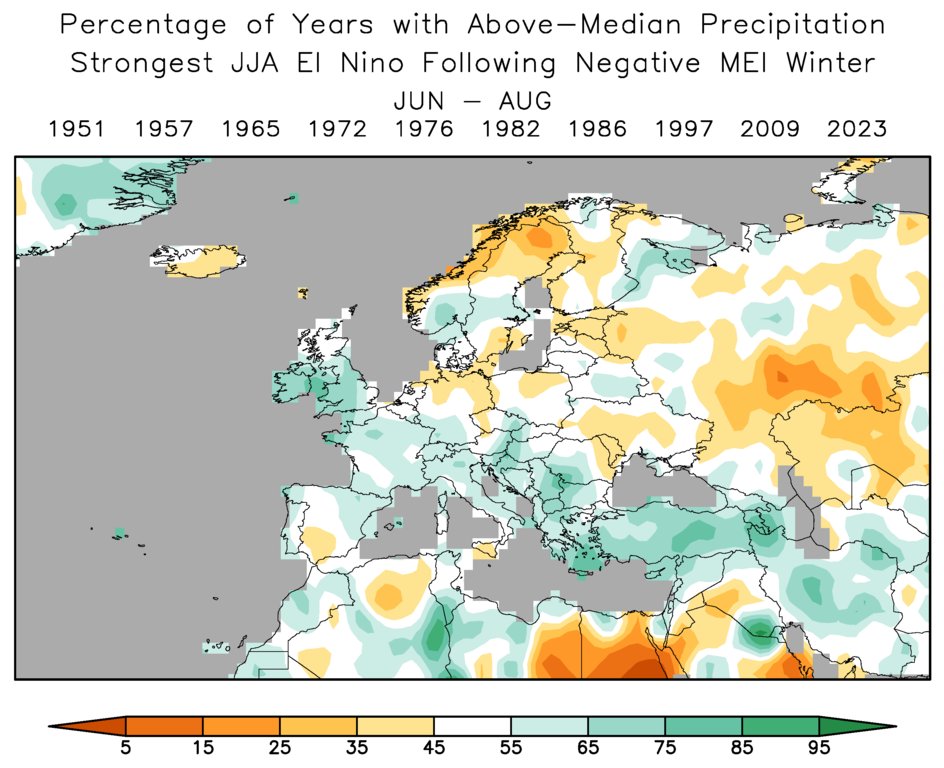
In last week's summer discussion for Europe, we compared the Copernicus forecast to similar hindcasts from 1997 and 2015 (major El Niño summers).
The 1997 forecast was relatively successful; 2015 not at all.
In general, the models can't capture summer N Atlantic ENSO impacts.
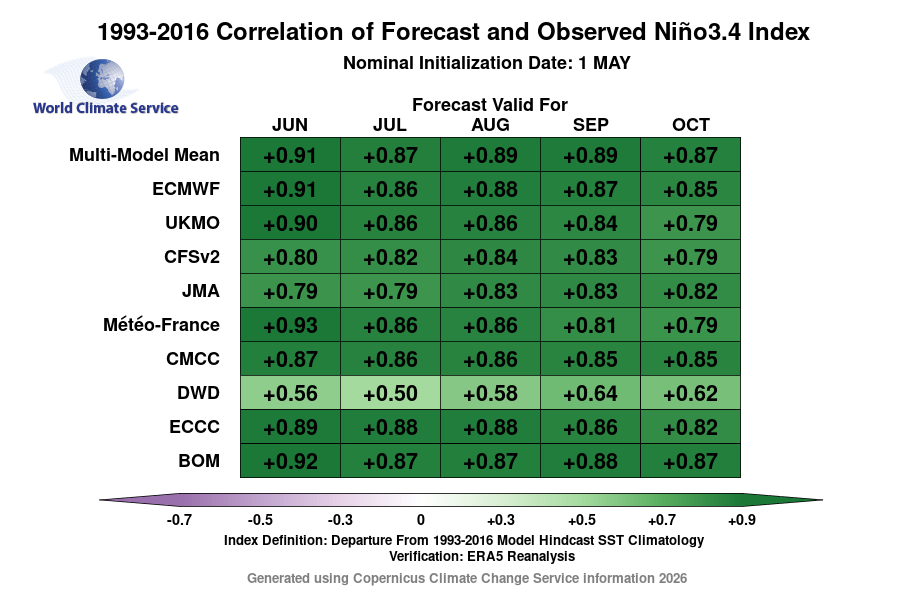
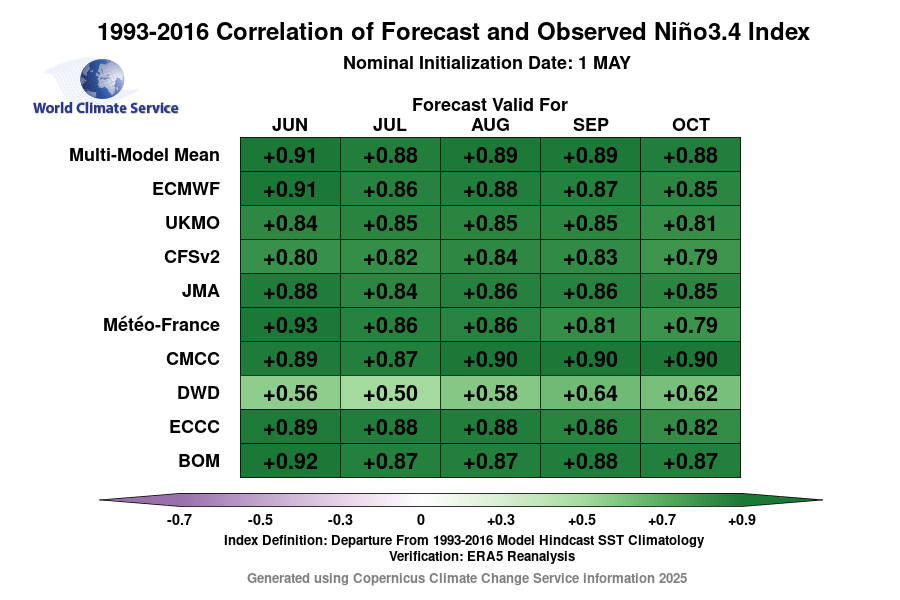
While the amplitude of the latest El Niño forecasts is a worthy headline, the latest C3S models show more variance than last month - both for traditional and relative Niño3.4 SSTs.
All models have warmed, but some much more than others.
(DWD is less credible - poor skill)
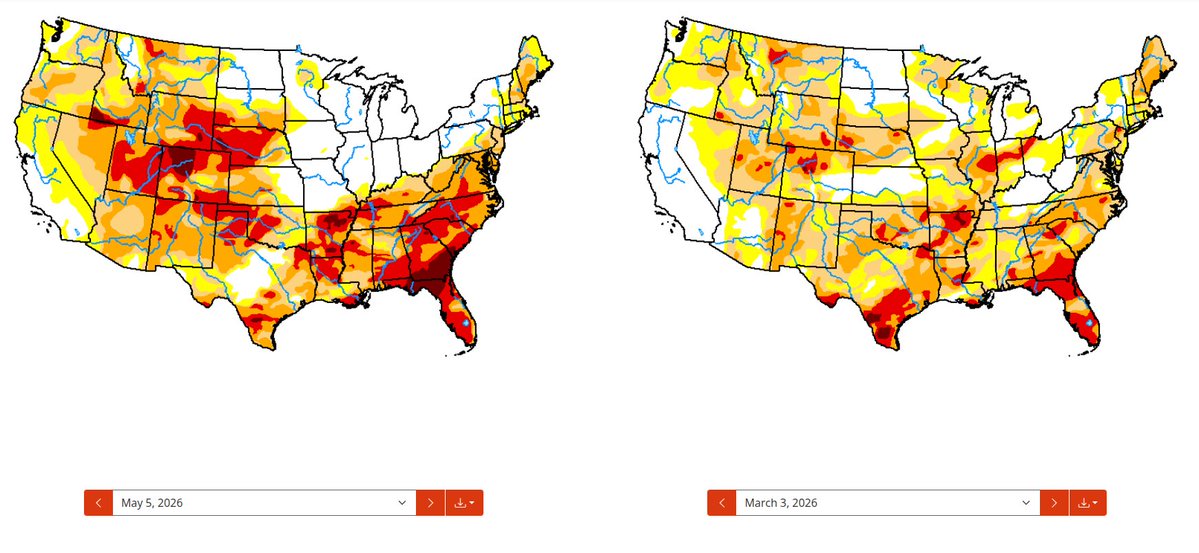
Good news as the U.S. Midwest growing season gets under way: drought/dryness have all but disappeared in the heart of the Corn Belt in the last two months, even as the Plains and Southeast have been very dry.
While drought in the Plains keeps worsening, the percentage of U.S. corn/soybean production NOT currently experiencing drought has increased significantly in the past two months.
In early March, only about 42% of U.S. corn production was outside a drought/dryness category. That figure has now risen to roughly 66% (top left panel).
#oatt #AgWx #AgWeather #Corn #Plant2026 #Weather
@GavinPartridge Interesting that 2007 is my top analog year for both the AMO (past 12 months) and the NAO (past 3 months). But yes, near-opposite Pacific this year
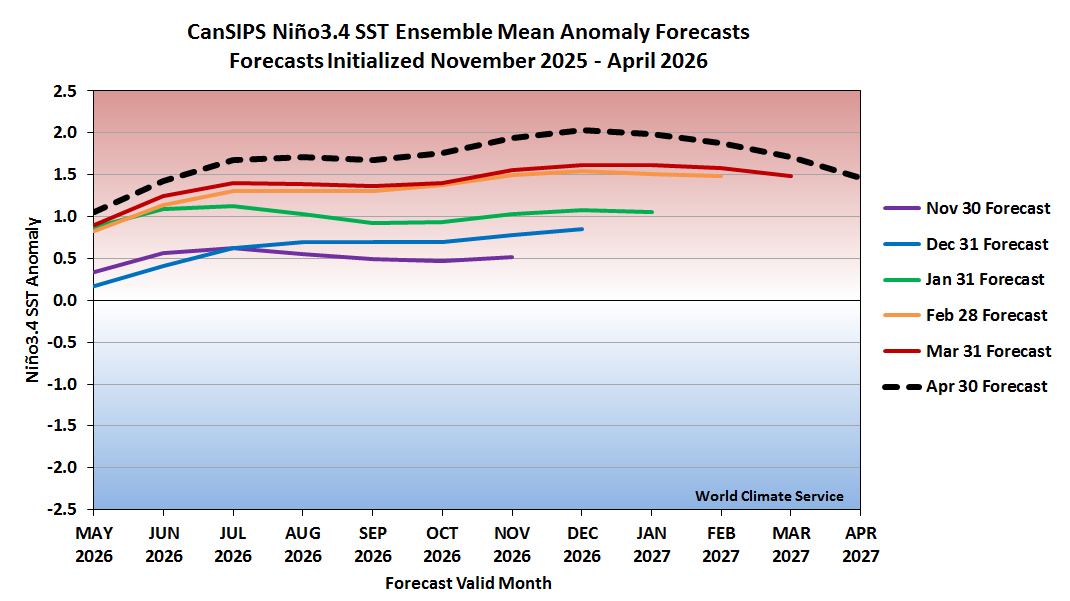
Yet another leg up in today's CanSIPS Niño3.4 forecast update.
The ensemble mean shows 9 months above +1.5°C anomaly. The ERSSTv5 record (1991-2020 baseline) is 8 consecutive months in 1997-98 and 2015-2016.
@MarkVogan Poor in terms of cloud and rain yes, but often warm. Propensity for heat waves depends very much on the pattern over northern Europe, which has historically been highly variable during El Niño.
The major El Niño episodes of recent decades have tended to develop in tandem with significant Arctic sea ice loss (2023, 2015, 2002, 1997).
However, there's only a slight overall correlation with summer ENSO. Mid-high latitude SSTs and flow anomalies are more closely related.